CompositeVariogram: Test Failed at /home/runner/work/GeoStatsFunctions.jl/GeoStatsFunctions.jl/test/theoretical/composite.jl:102
  Expression: #= /home/runner/work/GeoStatsFunctions.jl/GeoStatsFunctions.jl/test/theoretical/composite.jl:102 =# @elapsed(sill(γ)) < 1.0e-5
   Evaluated: 0.007924943 < 1.0e-5
The @elapsed test is placed after a warmup call, so it is not measuring compilation:
I don’t know what else I can do to preserve the performance of packages I’ve written a long time ago. I believe all of them contain idiomatic Julia code, follow best practices, etc.
I don’t think it’s true that the runtimes are getting worse in 1.12. The compiler is generally getting better over time, with better inference and more optimisations.
Performance regressions hit every language, although Julia is uniquely vulnerable to performance regressions among high-performance languages due to how Julia, by design, seamlessly mixes slow, dynamic code with fast statically inferred code. That makes it easy for the latter to slip into the former category undetected.
However, every release has some performance regressions which may be due to either small compiler details, or some changes in Base. It’s almost certainly one of these.
In this case, it would be helpful if you could drill down to what, precisely, is slowing down. Create a smaller, copy-pasteable example. Is something suddenly allocating? No longer SIMD’ing? These things are usually solvable.
If your question is broader: “How can I prevent performance regressions?”, then the answer is that there is no way - in any language - you can prevent them. But also, that Julia is expected to have a higher baseline of performance regressions.
It’s enough to reproduce, but there is some work needed to drill down to what is causing the regression among all the code in your package and all its dependencies.
What would be needed in order to pin down why the regression happened is some small example, ideally dependency-free, that can be copy-pasted directly into a REPL.
Profile on available platforms and identify code or dependencies to patch, I suppose. There are no performance guarantees across versions of source code, I don’t think that’s even feasible until you’re talking about a particular environment’s binaries on tested platforms. At the language level, you’re not only vulnerable to changes in the language implementation as this implies, you’re at the mercy of all of your dependencies. LoopVectorization eventually got some funding to be maintained for at least a while longer, but it was nearly deprecated for Julia v1.11 to the detriment of all the high-performance packages that relied on its loop auto-vectorization. Nobody sets out to cause performance regressions, but we do need people and resources to spot and fix anything.
We had some conversations on Zulip where some people started to suspect @elapsed is buggy, and could be leaking some extra time measurements that are not captured in BenchmarkTools.jl
Given that this regression is not reproduced locally in @nilshg and others’s machines, I wonder if it has to do with GitHub setup or @elapsed itself.
In my experience v1.12 CI is faster than v1.11 CI, and almost as fast as v1.10 CI. Obviously performance will depend on the workload. Not sure if it’s useful to bring up such “evidence” if you’re not going to dig into what is causing it.
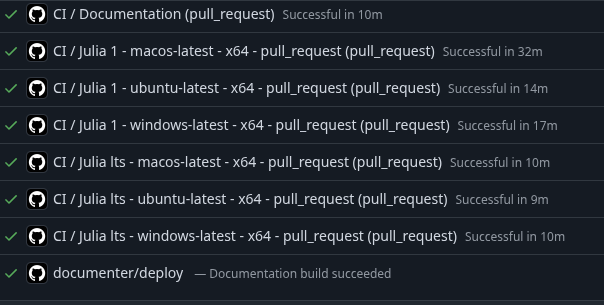
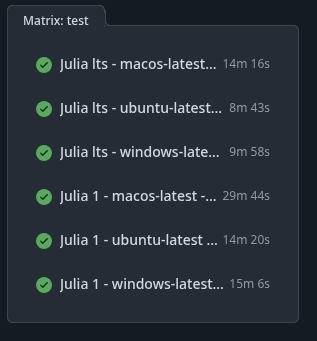
If you just look at the list of precompile timings, you can explain most of the difference. The test run time is just 40s longer on 1.12 ubuntu vs. lts ubuntu. Sure that‘s slower and worth looking into, but not 2x.
I have mentioned that before (though did not show a screenshot with the times). GMT CI times are the double for Julia 1.12 compared to 1.10 (12 min vs 24 min), but the big jump actually ocuured at Julia 1.11.
We are now talking about a completely different thing from what this thread started with. Is the original note about the runtime of 1.12 resolved and this thread has pivoted to end to end CI time?
Your assumption that @elapsed is an accurate way to measure the runtime of a function is wrong.
@btime is already better. Nevertheless, the performance of GitHub runners can vary widely.
Other question: Are you sure that code coverage is disabled when you run your performance tests? Code coverage testing can increase code execution time a lot in an unpredictable way.
I could certainly replace @elapsed by @btime and will probably do that when I find some time, however, it will just hide a performance regression, which can be the result of various things as you said (CI, codecov, etc.).
Suppose Julia v1.12 runtimes have improved compared to previous versions of the language, which is a reasonable hypothesis. Still, the net effect we are seeing across various packages is undeniable: tests take twice the time to finish with Julia v1.12.
Anyone can copy/paste the MWE from the test suite and run in their own machines with Julia v1.10, v1.11 and v1.12. If the @btime results match, then we can attribute the issue to the @elapsed implementation across Julia versions or to the interaction of Julia with GitHub CI and codecov tools.