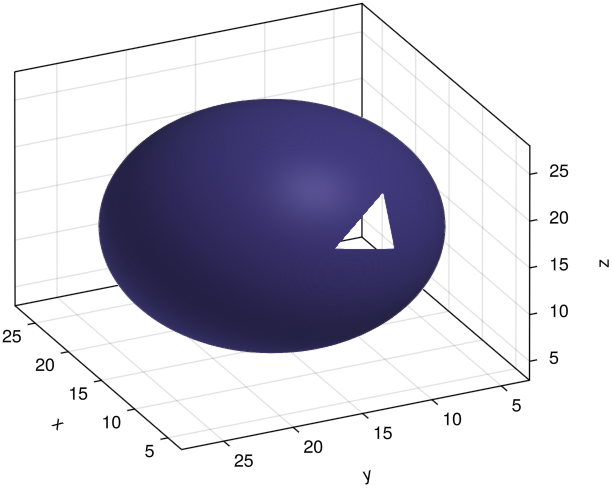
I am using contour() from GLMakie to create a 3d level plot. My problem occurs when I zoom in; white triangles appear at the edges of the box, which cover my plot:
Sure, here is the creation of the array ψ, which defines the ring I plotted. L is the size of the box (without zoom), and N sets the grid size (2^N points per axis):
"""
    Dipole vortex core structure
"""
function VortexRingWaveFunction(x::Real, y::Real, z::Real, L::Real, R::Real)
    # Padé approximation constants
    a1 = 11/32
    b1 = (5-32*a1)/(48-192a1)
    a2 = a1*(b1-1/4)
    b2 = a2

    # Calculate variables
    r  = hypot(x-L/2, y-L/2)
    r1 = hypot(r-R, z-L/2)
    r2 = hypot(r+R, z-L/2)

    ρ1 = r1^2*(a1+a2*r1^2)/(1+b1*r1^2+b2*r1^4)
    ρ2 = r2^2*(a1+a2*r2^2)/(1+b1*r2^2+b2*r2^4)

    return √(ρ1*ρ2)
end

L = 32
N = 7
R = 5

x_list = collect(LinRange(0,L,2^N+1)[1:end-1])
y_list = collect(LinRange(0,L,2^N+1)[1:end-1])
z_list = collect(LinRange(0,L,2^N+1)[1:end-1])
ψ = zeros(ComplexF64, 2^N, 2^N, 2^N)
for (n, x) in enumerate(x_list)
    for (m, y) in enumerate(y_list)
        for (l, z) in enumerate(z_list)
            ψ[n,m,l] = VortexRingWaveFunction(x, y, z, L, R)
        end
    end
end
That looks like a bug for Axis3 in combination with contour. For a more minimal MWE, consider
using GLMakie

xs = ys = zs = -1.5:0.1:1.5
ws = [x^2 + y^2 + z^2 for x in xs, y in ys, z in zs]  # contour surfaces are spheres

fig = Figure()
ax = Axis3(fig[1, 1])
contour!(ax, ws, levels=[1.])
display(fig)
Ah interesting, this happens when you scroll around. Maybe the contour has some kind of depth shift? It looks like the clip planes are applying too early somehow.