PyPlot Scatter-Plot Performance

I wrote a small program to display the “Hopalong Attractor”. The calculations themselves are relatively fast, as is the scatter plot if you only use a single color.
Coloring the scatterplot as a function of the distance from the origin point, the execution time is about 6 times longer. The use of “savefig” also increases the execution time significantly.

I use jupyter-lab to run (hence pygui=false)

I think that is a common known issue of scatter plot? Or improperly programmed? Or Jupyter Lab issue?

using PyPlot; pygui(false)                  # pygui open plot in seperate interactive window if true

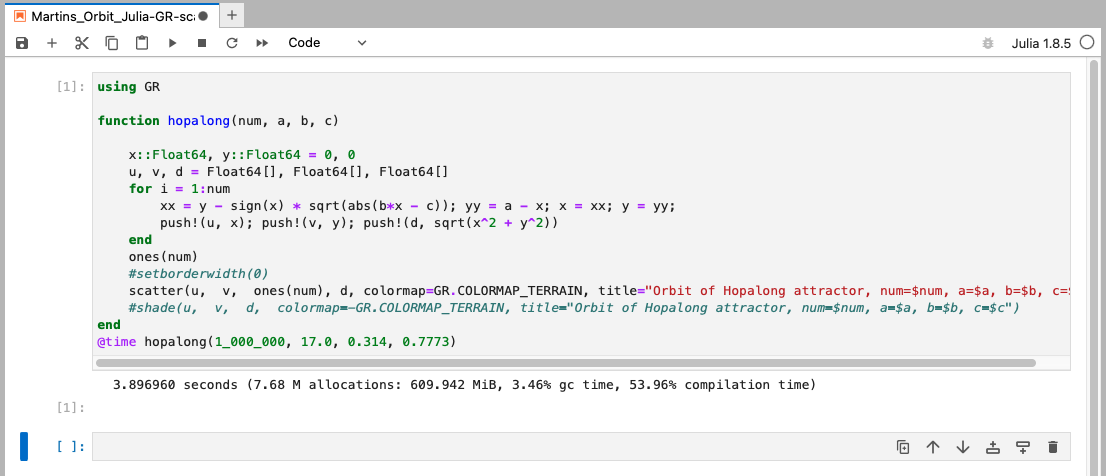
function hopalong(num,a,b,c)                # e.g.hopalong(1e6,-1.7,0.5,1.1)   
    
    x::Float64,y::Float64 = 0,0             # origin point
    u,v,d = Float64[],Float64[],Float64[]   # point vectors (x,y) and distance vector(d), color c of scatter = f(d)
    markerstyle="."; markersize = 0.1
    
    for i=1:num
        xx = y-sign(x)*sqrt(abs(b*x-c)); yy = a-x; x = xx; y = yy; push!(u,x); push!(v,y); push!(d,sqrt(x^2+y^2))
    end
    
    figure=PyPlot.gcf()
    figure.set_size_inches(10,8)
    #scatter(u,v,s=markersize,marker=markerstyle,c="black")
    scatter(u,v,s=markersize,marker=markerstyle,c=d,cmap="gnuplot")
    title("Orbit of Martin's Map(Hopalong attractor). Parameters: num=$num, a=$a, b=$b, c=$c,markerszie=$markersize",fontsize=10)
    #savefig("Martins_Pics/hopalong@num = $num , a = $a , b = $b , c = $c.png",dpi=300) 

end

hopalong(1e6,2.0,0.3,0.7)

That’s a general problem when drawing a huge number of marker symbols, which must be drawn internally by several lines and filled polygons. In GR, you can avoid this overhead using a data shader:

using GR

function hopalong(num, a, b, c)
    
    x::Float64, y::Float64 = 0, 0
    u, v, d = Float64[], Float64[], Float64[]
    
    for i = 1:num
        xx = y - sign(x) * sqrt(abs(b*x - c)); yy = a - x; x = xx; y = yy;
        push!(u, x); push!(v, y); push!(d, sqrt(x^2 + y^2))
    end
    #scatter(u,  v,  ones(num), d,  colormap=-GR.COLORMAP_TERRAIN, title="Orbit of Martin's Map (Hopalong attractor)")
    shade(u,  v,  d,  colormap=-GR.COLORMAP_TERRAIN, title="Orbit of Martin's Map (Hopalong attractor)")
end

hopalong(1_000_000, 2.0, 0.3, 0.7)
3 Likes

Thanks very much. Shade gets the job done much faster. I just don’t know why yet :slight_smile: and I still have to figure out the other details like formatting the font sizes etc.

When trying out different parameters (a, b, c), e.g. ‘hopalong(1_000_000,17.0, 0.314, 0.7773)’ if the figure is not centered with respect to the origin, it is noticable that the coloring does not depend on the distance to the origin ‘d=sqrt(x^2+y^2)’, when using ‘shade’. But with PyPlot’s “scatter” it does. Or am I wrong here?


I misunderstood your program. In this case, the data shader is not useful. An equivalent GR script would look like this:

using GR

function hopalong(num, a, b, c)
    
    x::Float64, y::Float64 = 0, 0
    u, v, d = Float64[], Float64[], Float64[]
    
    for i = 1:num
        xx = y - sign(x) * sqrt(abs(b*x - c)); yy = a - x; x = xx; y = yy;
        push!(u, x); push!(v, y); push!(d, sqrt(x^2 + y^2))
    end
    setborderwidth(0)
    scatter(u,  v,  ones(num), d,  colormap=GR.COLORMAP_TERRAIN, title="Orbit of Hopalong attractor, num=$num, a=$a, b=$b, c=$c")
    #shade(u,  v,  d,  colormap=-GR.COLORMAP_TERRAIN, title="Orbit of Hopalong attractor, num=$num, a=$a, b=$b, c=$c")
end

hopalong(1_000_000, 17.0, 0.314, 0.7773)

It’s faster (than the PyPlot version) on my machine, but the overhead is still there.

I also tried the GR JS version (with zoom, pan and hover functionality) - but it’s not very responsive.

Thanks very much once more and I highly apreciate your quick response and provided solutions!

However, the ‘GR scatter version’ results in a strange error on my machine: MacBook Pro Intel ,MacOS Ventura 13.2, Jupyterlab 3.6.1, Julia 1.8.5. See attached.

But without Jupyter directly in a Julia terminal and REPL it is working.

So seems to be an issue with my Jupyter

I have updated IJulia and suddenly the ‘GR scatter version’ is also working within Jupyter-Lab as well.
However, only for num up to 100_000. If num is lager e.g. 1_000_000 it doesn’t display the image anymore or maybe it would take very long time to display…
Seems that with increasing value of num also the resources are increasing significantly!

So thank you very much again for your efforts and response but for the time being I will stay with PyPlot. This is at least working up to 10_000_000 and for 1_000_000 it takes around 6 seconds on my machine which is acceptable.

GLMakie is yet way faster

using GLMakie
using ColorSchemes

function hopalong(num,a,b,c)               # e.g.hopalong(1e6,-1.7,-0.3,0.7)     

    x,y=Float64(0),Float64(0)              # origin point
    u,v,d = Float64[],Float64[],Float64[]  # point vectors and distance vector, color c of scatter = f(distance)                  
    ms = 0.000001                          # marker size
    
    for i=1:num
        push!(u,x); push!(v,y); push!(d,sqrt(x^2+y^2)); xx = y-sign(x)*sqrt(abs(b*x-c)); yy = a-x; x = xx; y = yy        
    end

    scatter(u, v, color=d, colormap=:inferno, markersize=ms)

end
1 Like

This is really amazing

Can we make the animation from nothing to become this fractal?

@jheinen, would it be possible to have a Plots.jl’s grjs() backend?

using GLMakie
using ColorSchemes

function hopalong(num,a,b,c)               # e.g.hopalong(1e6,-1.7,-0.3,0.7)     

    x,y=Float64(0),Float64(0)              # origin point
    u,v,d = Float64[],Float64[],Float64[]  # point vectors and distance vector, color of scatter = f(distance)                  
    ms = 0.000001                          # scatter marker size
    
    for i=1:num
        push!(u,x); push!(v,y); push!(d,sqrt(x^2+y^2)); xx = y-sign(x)*sqrt(abs(b*x-c)); yy = a-x; x = xx; y = yy        
    end
    
    scatter(u, v, color=d, colormap=:inferno, markersize=ms)
end

References

Barry Martin, Computer Recreations, Scientific American, Sept 1986.

2 Likes

would it be possible to have a Plots.jl’s grjs() backend?

Yes, in principle that would be possible. But unfortunately we don’t have the time at the moment. Such a backend would have to be rewritten from scratch.

1 Like