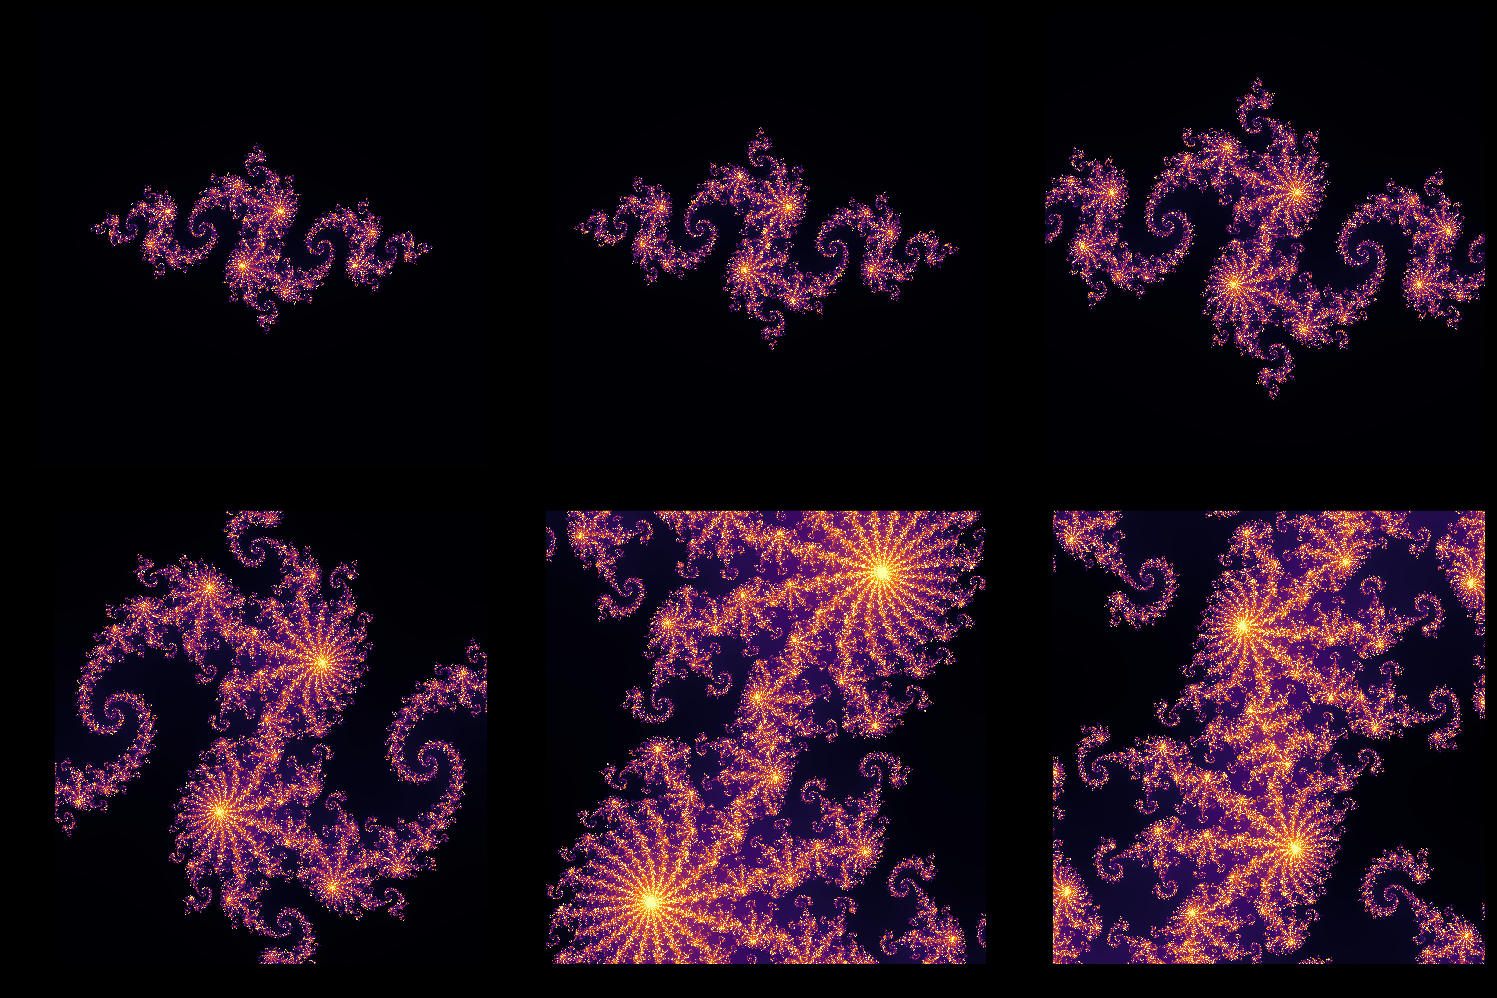
So I am creating a gif of a Julia set zoom using the Plots.jl package (gr backend), and there are two problems I am unable to solve:
Firstly, the plot doesn’t cover the entire window despite removing the axes and legend (showaxis, legend = false), and there is always some background showing.
Secondly, it appears that sometime the plot size changes during the animation, despite it being constant, but only on the left size
More specifically:
heatmap(x, y, z, background_color = :black, showaxis = false, legend = false, size=(WIDTH, HEIGHT))
Other than those two problems everything works as it should, but as said I have not found a solution despite trying various fixes.

1 Like
For the first problem, load using Measures, and adjust manually the keywords: leftmargin=-10mm, rightmargin=-5mm, etc.
For the second problem, try providing fixed xlims=(xmin, xmax), ditto for ylims.
From your animation, it seems that the first column (at x_min) turns black at certain frames. Could you check the corresponding z-values?
It seems the longer the gif I produce, the larger the “jumps” become… I have not noticed anything amiss with the z values.
OK, I think it’s time to ask for a minimum working example (MWE).
function CalcJuliaQuad(x::Float64, y::Float64, c::ComplexF64 = complex(-0.8, 0.156))::Int
    f(x) = x^2 + c
    R::Float64 = 1 + sqrt(1 + 4abs(c))
    temp = complex(x, y)
    k::Int = 0

    while k < PREC && abs(temp) <= R
        temp = f(temp)
        k += 1
    end
    return k
end

function JuliaZoomGif(zoom, duration, zpoint = (WIDTH / 2, HEIGHT / 2))
    x_min, x_max, y_min, y_max = X_MIN, X_MAX, Y_MIN, Y_MAX
    ts = range(1, stop = zoom, length = 30 * duration)
    anim = @animate for (i, t) in pairs(IndexStyle(ts), ts)
        dx, dy = x_max - x_min, y_max - y_min
        dxp, dyp = dx * inv(t), dy * inv(t)
        xratio, yratio = zpoint[1] / WIDTH, zpoint[2] / HEIGHT
        x_center = x_min + dx * xratio
        y_center = y_min + dy * yratio
        x_min = x_center - dxp / 2
        x_max = x_center + dxp / 2
        y_min = y_center - dyp / 2
        y_max = y_center + dyp / 2

        x, y = x_min:((x_max - x_min) / WIDTH):x_max, y_min:((y_max - y_min) / HEIGHT):y_max
        z = CalcJuliaQuad.(x', y)
        println("Generating Frame: $i")
        heatmap(x, y, z, background_color = :black, showaxis = false, legend = false, size=(WIDTH, HEIGHT), leftmargin = -13mm, bottommargin = -9mm, rightmargin = -2mm, topmargin = -2mm)
    end
    gif(anim, "Zoom/juliaZoom_fps30zoom$zoom.gif", fps = 30)
end
Note that a number of constants are missing from the MWE above, meaning the code cannot be executed as it is.
The constants are just the width and height of the plot, and the initial limits for the xs and ys. These change to perform the zoom.
What happens if you omit the input x-y axes in heatmap(x, y, z, …) ?
I.e., run it as:
heatmap(z, …)
1 Like
This seems to work! Thank you very much!
