The title pretty much. See this Github workflow for an example. 1.12 and 1.11 take 8 minutes, vs 1.10 at 3 minutes.
Does anyone know why this is happening?
The title pretty much. See this Github workflow for an example. 1.12 and 1.11 take 8 minutes, vs 1.10 at 3 minutes.
Does anyone know why this is happening?
This is indeed a problem, and I’ve noticed it too. But I’m not sure what’s behind it.
People have been wondering this for a while, there is even a precompilation etc. benchmark, where timings can vary with setup enough that it’s not as simple as your observed regression at 1.11. For 1.11 specifically, people often bring up moving Array code from C into Julia and stdlib excision from the sysimage. We can expect some changes to compilation from those, but there’s no easy way to tell how much those factor into any specific situation.
I don’t think anybody has really come up with a satisfactory explanation yet. Part of the problem is that varying the Julia version also changes LLVM and what packages are compatible in otherwise identical environments, so that’s a whole lot that changes outside of the base Julia repo and hasn’t been finely controlled in any benchmarks so far. Does anyone know if we can at least list out every method specialization and how long it took to compile each? Maybe we could at least try to compare across version changes.
I think in this package specifically is hurt more than most by the memory changes. I was taking a look and the __generic_kernel! that is the core computational kernels of this function (which were already huge functions) went from around 22k lines of IR in 1.10 to 55k in 1.12. This means that Julia has to do a lot more work here, same for LLVM. So that already would increase the compile time by a lot, and then there is the fact that compilation/optimization is rarely a O(N), it’s usually slightly more than that.
For reference after optimization the LLVM that ends up being generated is 10k lines of IR less in 1.12 over 1.10 (52k vs 40k)
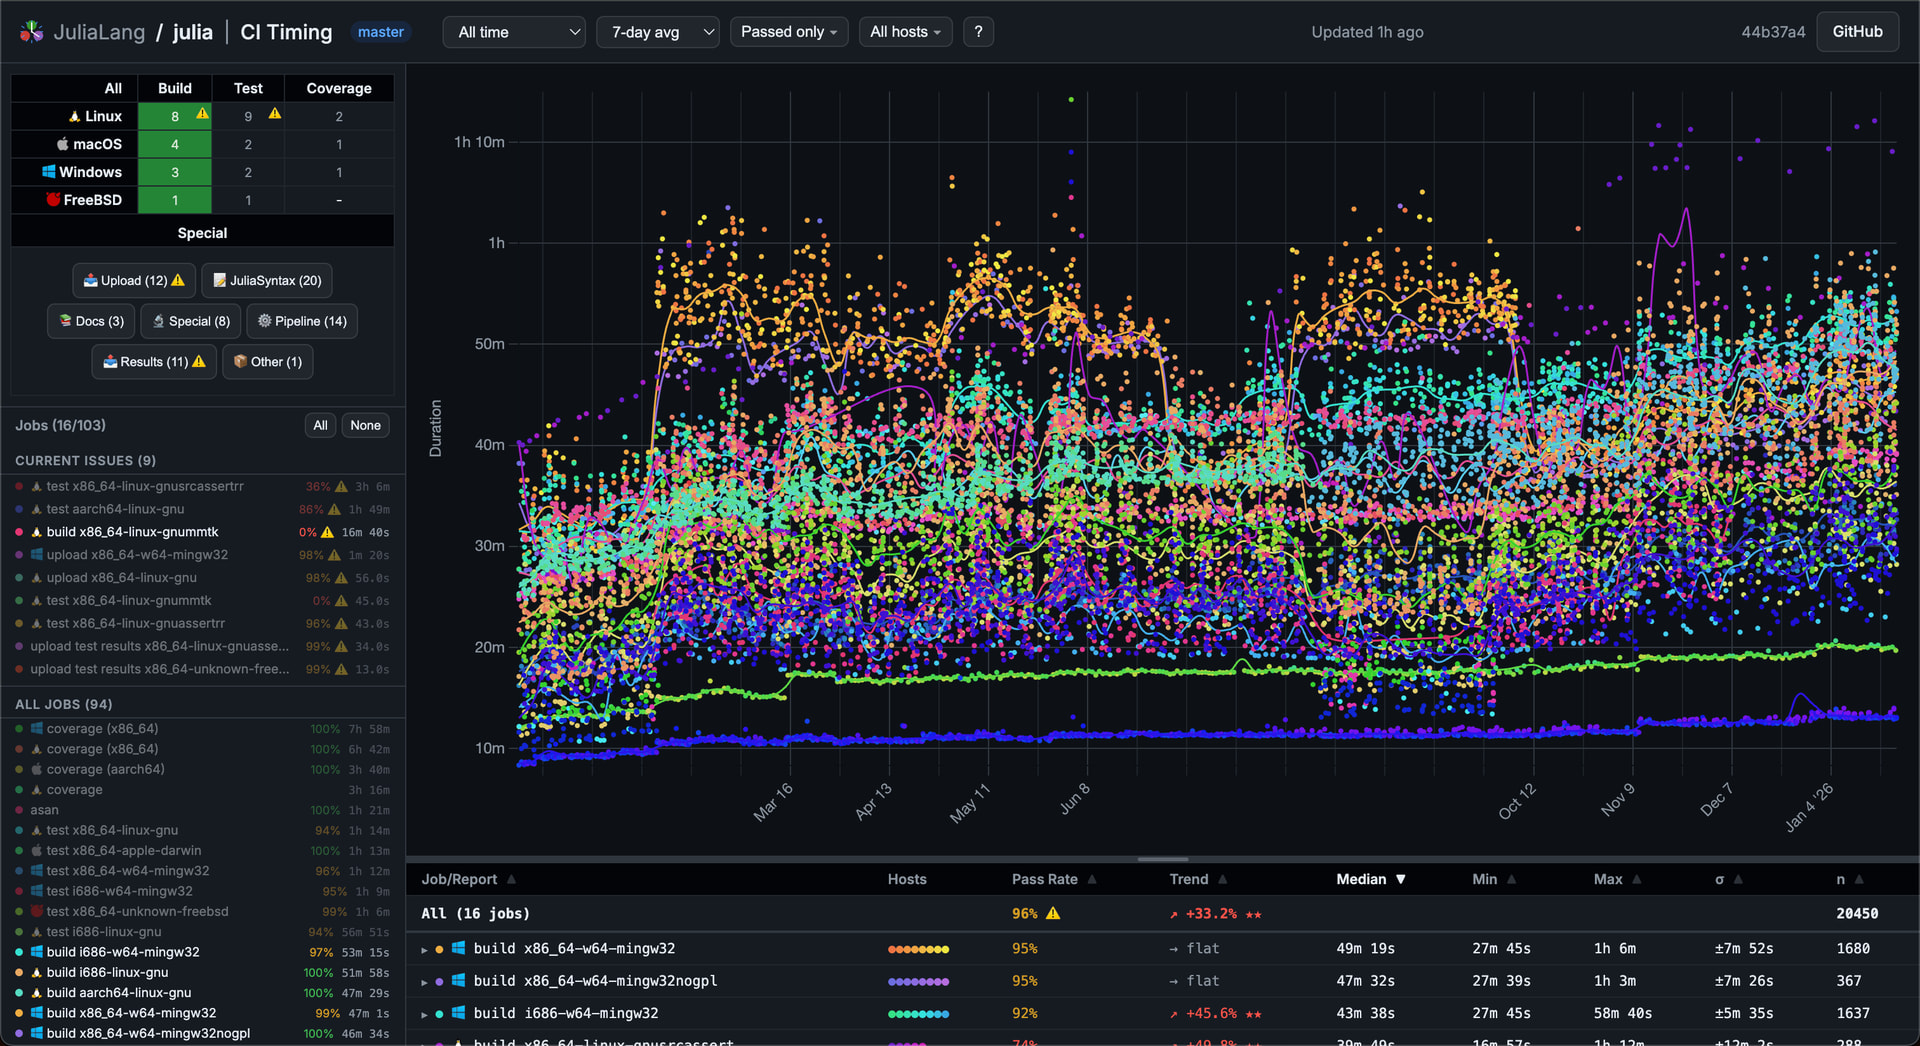
One datapoint/tool here is the new julia CI timing tracking site. If you just look at building julia master for CI (various platforms, configurations) over the last year, there have been some temporary blips but it’s trended upwards +33% on average. Building julia !== precompiling packages, and different agents are used so it’s noisy, but it might be helpful for visually identifying jumps.
All build jobs, all time (data only available since end of 2024)
Is there anything that could be done to simplify the amount of work for the compiler? Otherwise it sounds like the only fix is to somehow do even more caching so stuff doesn’t get recompiled so often, and disable world splitting so compiled code doesn’t get invalidated ![]()
Not much outside of optimizing the compiler more and more (not just caching but making it faster overall)
World-splitting is only a fraction of what causes invalidations, and that optimization would be sorely missed in moderately type-unstable code e.g. comparisons returning Bool (though these cases could also be solved by a hypothetical function-wise return type annotation). More generally, letting a compiler do less work would tend to cause runtime regressions. If we go to the other extreme of a dynamic language implementation that doesn’t optimize anything during typical runtimes and juggles units of AOT-compiled code, we get the complaints of “slow” CPython.
In my experience, the most frequent causes of redoing precompilation are my manual changes to environments and juggling too many overlapping environments at once. I don’t think there’s much that can be done about that aspect; this generics-heavy language leans hard toward whole program optimization instead of modular binaries (like Swift). By the time a (likely packaged) program and its environment settles, I do prefer to pay more upfront precompilation cost than run slower every time.
This case here doesn’t have anything to do with world splitting or changes, it’s just the compiler getting slower to generate better code
Similar experience in ModelPredictiveControl.jl:
for example here (edit: it was not executed on v1.11 in this job, but I had similar results on it, I can provide them if it’s needed). It clearly worsens the experience of interactive programming. It feels like
… “interactive” …
since 1.11, tbh
edit: I have noticed some improvements on v1.13 a.k.a. pre although, this is encouraging!
Why is Julia generating twice the amount of IR? If this is a pattern (it would explain some of the 2x in CI times we‘ve been seeing) maybe something can be done.
I agree, it definitely hurts the user experience, particularly new users, to have such very long install times and upgrade times. I reference this previous previous post of mine, which is highly related: Pre-built binaries via the registry
Because of the memory change. So array operations that used to be one IR instruction became several (they would become multiple LLVM instructions anyway). For example, a get index used to be one thing, now it’s a bounds check + the get index. So it’s basic block and comparison etc.
Any chance that there could be a compiler pass that could cut this in half? Or would this change inevitably be O(n) because you can now prove less?
Yeah, if we got better at removing bounds checks in the front end most of the overhead would go away.
The example that I posted in that other parallel thread shows that, at least for that package, nightly jumped compile times by ~25 % from the not-yet-released 1.13 to nightly, so there is (way) more than bounds checking.