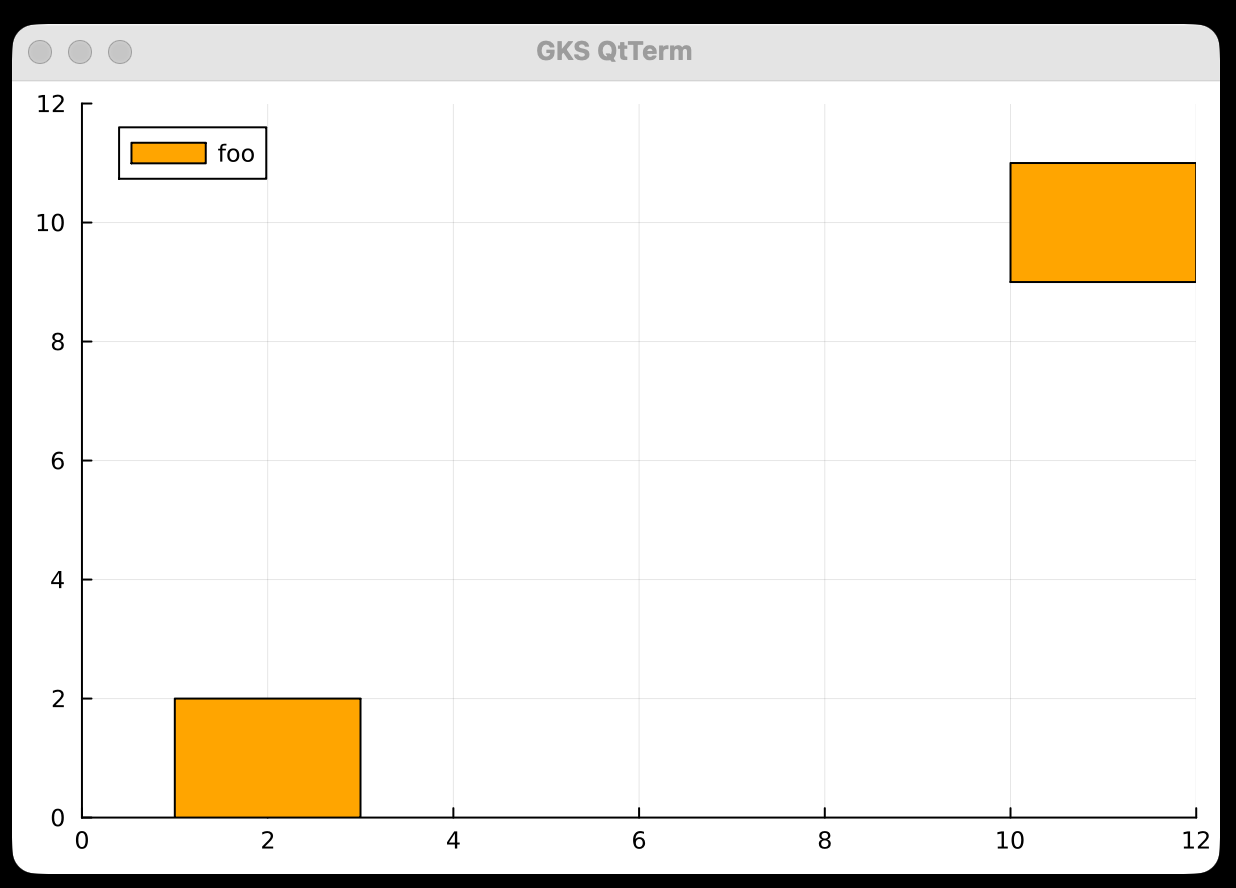
I’m trying to plot several rectangles of the same color, and I want them to show up as a single entry in the legend. But my code produces a separate legend entry for each rectangle. Suggestions?
using Plots

function rectangle(w, h, x, y; voffset=0)
    y -= 0.5*h
    if voffset != 0
        y += voffset*h
    end
    Shape(x .+ [0,w,w,0], y .+ [0,0,h,h])
end

shapes = [rectangle(2,2,1,1), rectangle(2,2, 10,10)]
p = plot(xlim=(0,12), ylim=(0,12))
plot!(p, shapes; color=:orange, label="foo")
I should add that the rectangles are not all the same size, so I can’t just define a rectangular marker with markershape and do a scatter plot.