I would like to incrementally build a plot from different subplots using layout. The issue I’m struggling with is that the number of subplots is a parameter/variable. So I would like to build a list of subplots, then pass this on to plot with a certain layout that is built using grid. Code example (that doesn’t work but I don’t seem to figure out to get it working):
Nplots = 3
l = @layout [Plots.grid(1, Nplots); b]
p = empty()
x = range(1,10,1001)
for i in range(1, Nplots)
append!(p, plot(x, sin.(x)))
end
q = plot(x, cos.(x))
plot(p…, q, layout = l)
What am I missing here? Is there a “standard” way to incrementally build up a plot from subplots where the number of subplots is variable?
Thanks but I would like to avoid Makie for the moment simply because it uses Float32’s under the hood and I’ve run into multiple issues with precision loss (in log plots)…
As far as I can see, the problem is not in the layout. What you have to do is this:
p = [] instead of p = empty()
push!(p, plot(x, sin.(x))) instead of append!(p, plot(x, sin.(x)))
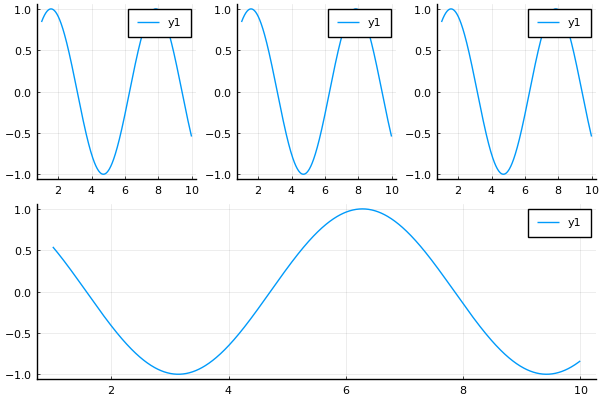
After these changes the code worked correctly and produced the following picture
Also the ‘standard’ way to define ranges is 1:Nplots, not range(1, Nplots).
Thanks for the solution. Any insight on what the background of my mistakes is? empty() vs [] and push! vs append!? Just so I understand and not blindly copy/paste?
I think you formatted the example code using a markdown quote instead of a code block, so the empty line shows a checkbox instead of empty([ ]). Then when we copy the code we get just empty(), which is not valid Julia.
Anyway p = empty([ ]) is not wrong but a useless complication of p = [] (writing [] already makes an empty vector, no need to make another one by calling empty.
We write push!(x, yi) to append one value yi to x, and append!(x, y) to append a collection of values. So append!(p, plot(x, sin.(x))) will take the result of plot, and take what is inside (a subplot) to append to the p vector. In the end you get a vector of subplots instead of a vector of plots.