I want a plot with an inset that has two y axes. Even when I first make a plot with a twin axis, and then try to add it as an inset, it modifies the plot that the inset should be in.
using Plots
pyplot()

twinPlot = plot(rand(10))
plot!(twinx(), 10rand(10))

mainPlot = plot(100rand(10))
plot!(twinPlot,
    inset = bbox(0, 0, 0.4, 0.4, :center),
    subplot = 2)
This thread (How to add an inset to a plot - #13 by SDA) mentions a recipe to do something similar, but they link to something that seems to be missing now: https://docs.juliaplots.org/latest/generated/gr/#gr-ref40
Thanks for any suggestions!
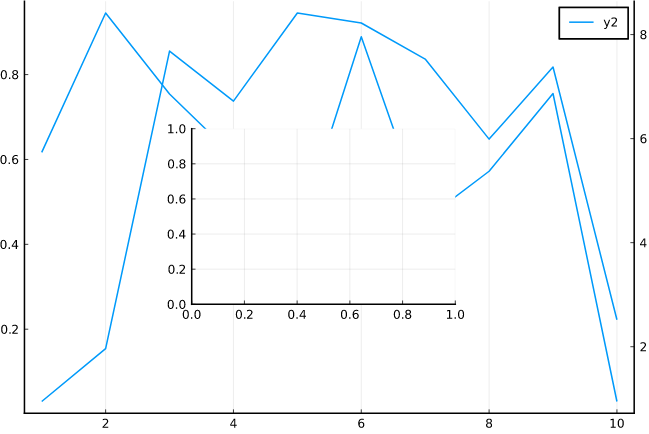
Would you like to insert an inset with dual axes as follows?
Plots.jl code
using Plots; gr(dpi=600)

p = plot(100rand(10), c=:green)
plot!(p, rand(10), c=:blue, inset=bbox(0, 0, 0.4, 0.4, :center), subplot=2)
plot!(twinx(p[2]), 10rand(10), c=:red)
plot!(p[2], framestyle=:box)
Yes, that looks great! Could you share the code?
As requested, the code is now included below the plot.
Thank you very much! For some reason I can’t seem to make the framestyle of the outer plot be boxed with ticks on all sides. Is that something you might also be able to help me with?
From the Plots.jl call center, the pgfplotsx() and pyplot() backends provide this feature, but I don’t know of an easy solution for the others without labour.
Please check the following page here.
