I am trying to understand how to plot a figure with an inset in Julia using the Plots package. I have tried the examples in the documentation without too much success (see https://docs.juliaplots.org/latest/layouts/). I have only found a few other examples on the web (see for example http://www.breloff.com/images/juliacon/plotswithplots.slides.html), but these were not clear or specific enough to clear my doubts. Currently, I am confused about the relation between subplots and insets. Could somebody provide a very basic example using just one plot with one inset? Then another example using one plot with two subplots and one inset in one of them?
I’m not sure what you mean when you say the examples aren’t giving you much success, but perhaps you’re having trouble translating them to your particular application? Anyway, here is something like what you asked for.
f(x,y) = x*y
x = y = -10:10
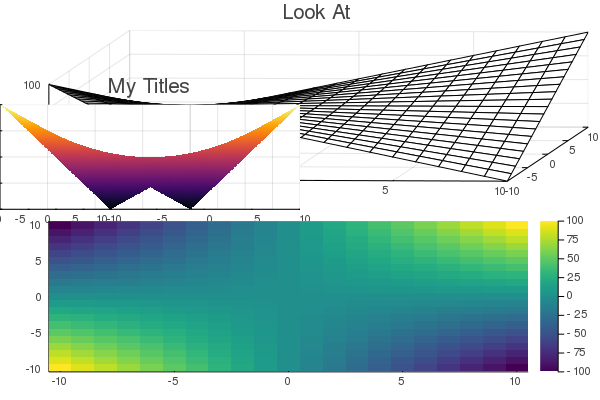
# a plot with an inset
p1 = plot(x, y, f,
seriestype = [:wireframe, :surface],
inset_subplots = bbox(0, 0, 0.5, 0.5, :bottom),
title = ["Look At" "My Titles"],
camera = [(10, 45) (60, 0)],
colorbar = false)
# a second plot
p2 = heatmap(x, y, f, c = :viridis)
# two subplots where one of them has an inset
plot(p1, p2, layout = (2, 1))
Thank you for the response. For clarification, my lack of success is in the understanding of the example. If I tried to run it by copy-paste so I can play with it to understand how it works, then it didn’t work on my computer, and I couldn’t figure out why. It was too complicate to disentangle the problem. My point is that, perhaps, simpler more straightforward but still general examples, instead of other more “flashy” ones could be sometimes more educative.
In any case, let me ask a question about your example. What if I want p1 to have an inset which is not a function of the “domain” x. How do you do it?
plot( 1:5 )
plot!( -5:8, (-5:8).^2, inset = (1, bbox(0.1,0.0,0.4,0.4)), subplot = 2)
Where 1 is the subplot index where the inset should appear and subplot = 2 assigns the correct subplot index to this series.
Thank you for your answer. Now is clearer. Although I still think I don’t clearly understand the idea of subplot index. It seems to me that certain stuff are occurring implicitly. Wouldn’t it be better to have a more explicit notation? For instance, from an user perspective (I am not an expert on Julia), I would find more transparent something like the following:
a1 = axes2d(xrange=(0.0,10.0),yrange=(1.0,100.0),ylogscale=true,...)
a2 = axes2d(xrange=(-1.0,1.0),yrange=(-10.0,10.0),...)
plot_curve2d!(a1,x1,y1) # here I assume x1 and y1 are defined somewhere
plot_curve2d!(a2,x2,y2) # we plot another curve in another axes.
plot!(c,a1) # now we plot axes a1 in the canvas c.
plot_inset!(c,a2,bbox=(0.1,0.0,0.4,0.4)) # now we plot axes a2 in the canvas c but as an inset.
Most likely my notation doesn’t follow Julia’s standards. I just want to communicate an idea, which may be imprecise or even wrong, but, hopefully, it could be helpful.
[Apologies for the mess, I am not sure if I have replied to ``BeastyBlacksmith’’ or not.]
Yes, you did.
So this is more a matter of phisolophies.
The idea of Plots.jl is that you only need to specify your intent and it will take care of the boilerplate code and the rest.
The syntax you describe is pretty similar to what pgfplots (for which there are two wrappers: PGFPlots.jl and PGFPlotsX.jl) or Makie.jl does.
Thanks for your example. Unfortunately, I have tried it on my installation of Julia and the outcome looked different. Moreover, I didn’t help me to understand. I see 3 plot commands. The last combines p1 and p2 into one canvas with two pannels, one above and one below. The second plots the heatmap in the lower pannel. However, the first one is still confusing. It plots the same surface two times. I would like to plot say some function f in the upper pannel, and later, something different, say function g in a different domain, in an inset within that pannel.
Ok, I see your point that it’s best to start small and simple. Here are two separate commands plotting two separate functions, one inset within the other.
# here is the main surface plot
plot(x, y, f, seriestype = :surface)

# here we plot on top of it (with `!`), specifying
# inset = (parent_subplot, bounding_box), and specifying that
# we're drawing on `subplot = 2` (our current subplot)
plot!(x, y, inset = (1, bbox(0, 0, 0.5, 0.5, :top)), subplot = 2)
Hi,
I wonder if it is possible to make an inset from a plot I already produced somewhere else.
It is not uncommon to have functions like this:
function make_my_plots(data)
    #do things
    data .+ 1
    return plot(data)
end

function make_my_plots(data)
    #do things
    myplot=plot()
## these are complex commands that do not fit in a single command
    plot!(data .+1)
    plot!(data .^2)
    return myplot
end

myplot= make_my_plot([1,2])
another_plot = plot([3,4], subplot=2)

## and something like this!
plot(my_plot, inset=another_plot)
Thanks!
Sorry, but I don’t know of a way off the top of my head. But I always recommend any plotting function be defined along the lines of:
myplot!(p::Plot, args...; kwargs...) = # do the thing
myplot(args...; kwargs...) = myplot!(plot(), args...; kwargs...)
This makes it much easier to compose subplots, tune the look of a plot ad-hoc, etc. You can also define a custom recipe to get the same effect (and more) but while I often find that overkill, the above is a basic necessity for me.
Hi alequa,
Did you figure out how to do this? I too would like to include an inset that is the same plot as the main figure but with a different xlims defined.
Kind regards
SDA
Nowadays we have a recipe for that http://docs.juliaplots.org/latest/generated/gr/#gr-ref40
Thank you!
The updated version of that link is Lens · Plots
I do have another solution for this, it is a bit awkward but works for every plot you might have. You can even do things like creating the inset in Makie, or Plotly and the main plot in Plots.
# Import
using Plots, Images

# Main plot
p1=Plots.plot(rand(10), label="main plot")

# Inset plot, this may be as complicated as you want
p2=Plots.plot(rand(10), label="inset")

#Saving the inset plot to file
file_path="inset.pdf"
Plots.savefig(p2, file_path)

# Now do the combined plot reading the inset as an image from file
Plots.plot(p1)
Plots.plot!(inset=bbox(0.1, 0.1, 0.3, 0.3))
Plots.plot!(Images.load(file_path), subplot=2, axis=false)