Yes, joining three bands in a RGB image is simple, but if images comes from sentinel satellite it’s expected that they retain the geo-referentiation and that’s what the RemoteS procedure does.
I was checking the RemoteS.jl repository and following the example there, however I have the following error: MethodError: no method matching gmtread(::GMTgrid{Float32, 2})
This error only appears when using Irgb = truecolor(Ir, Ig, Ib);
The following lines work without a problem:
Ir = gmtread("Inputs/Bands_Indices-S2/B04.tif");
Ig = gmtread("Inputs/Bands_Indices-S2/B03.tif");
Ib = gmtread("Inputs/Bands_Indices-S2/B02.tif");
Hmm, I see. I think that the truecolor function is expecting an unsigned integer but you are passing them floats. GMT has an imagesc function that should be what you need to convert to that truecolor expects.
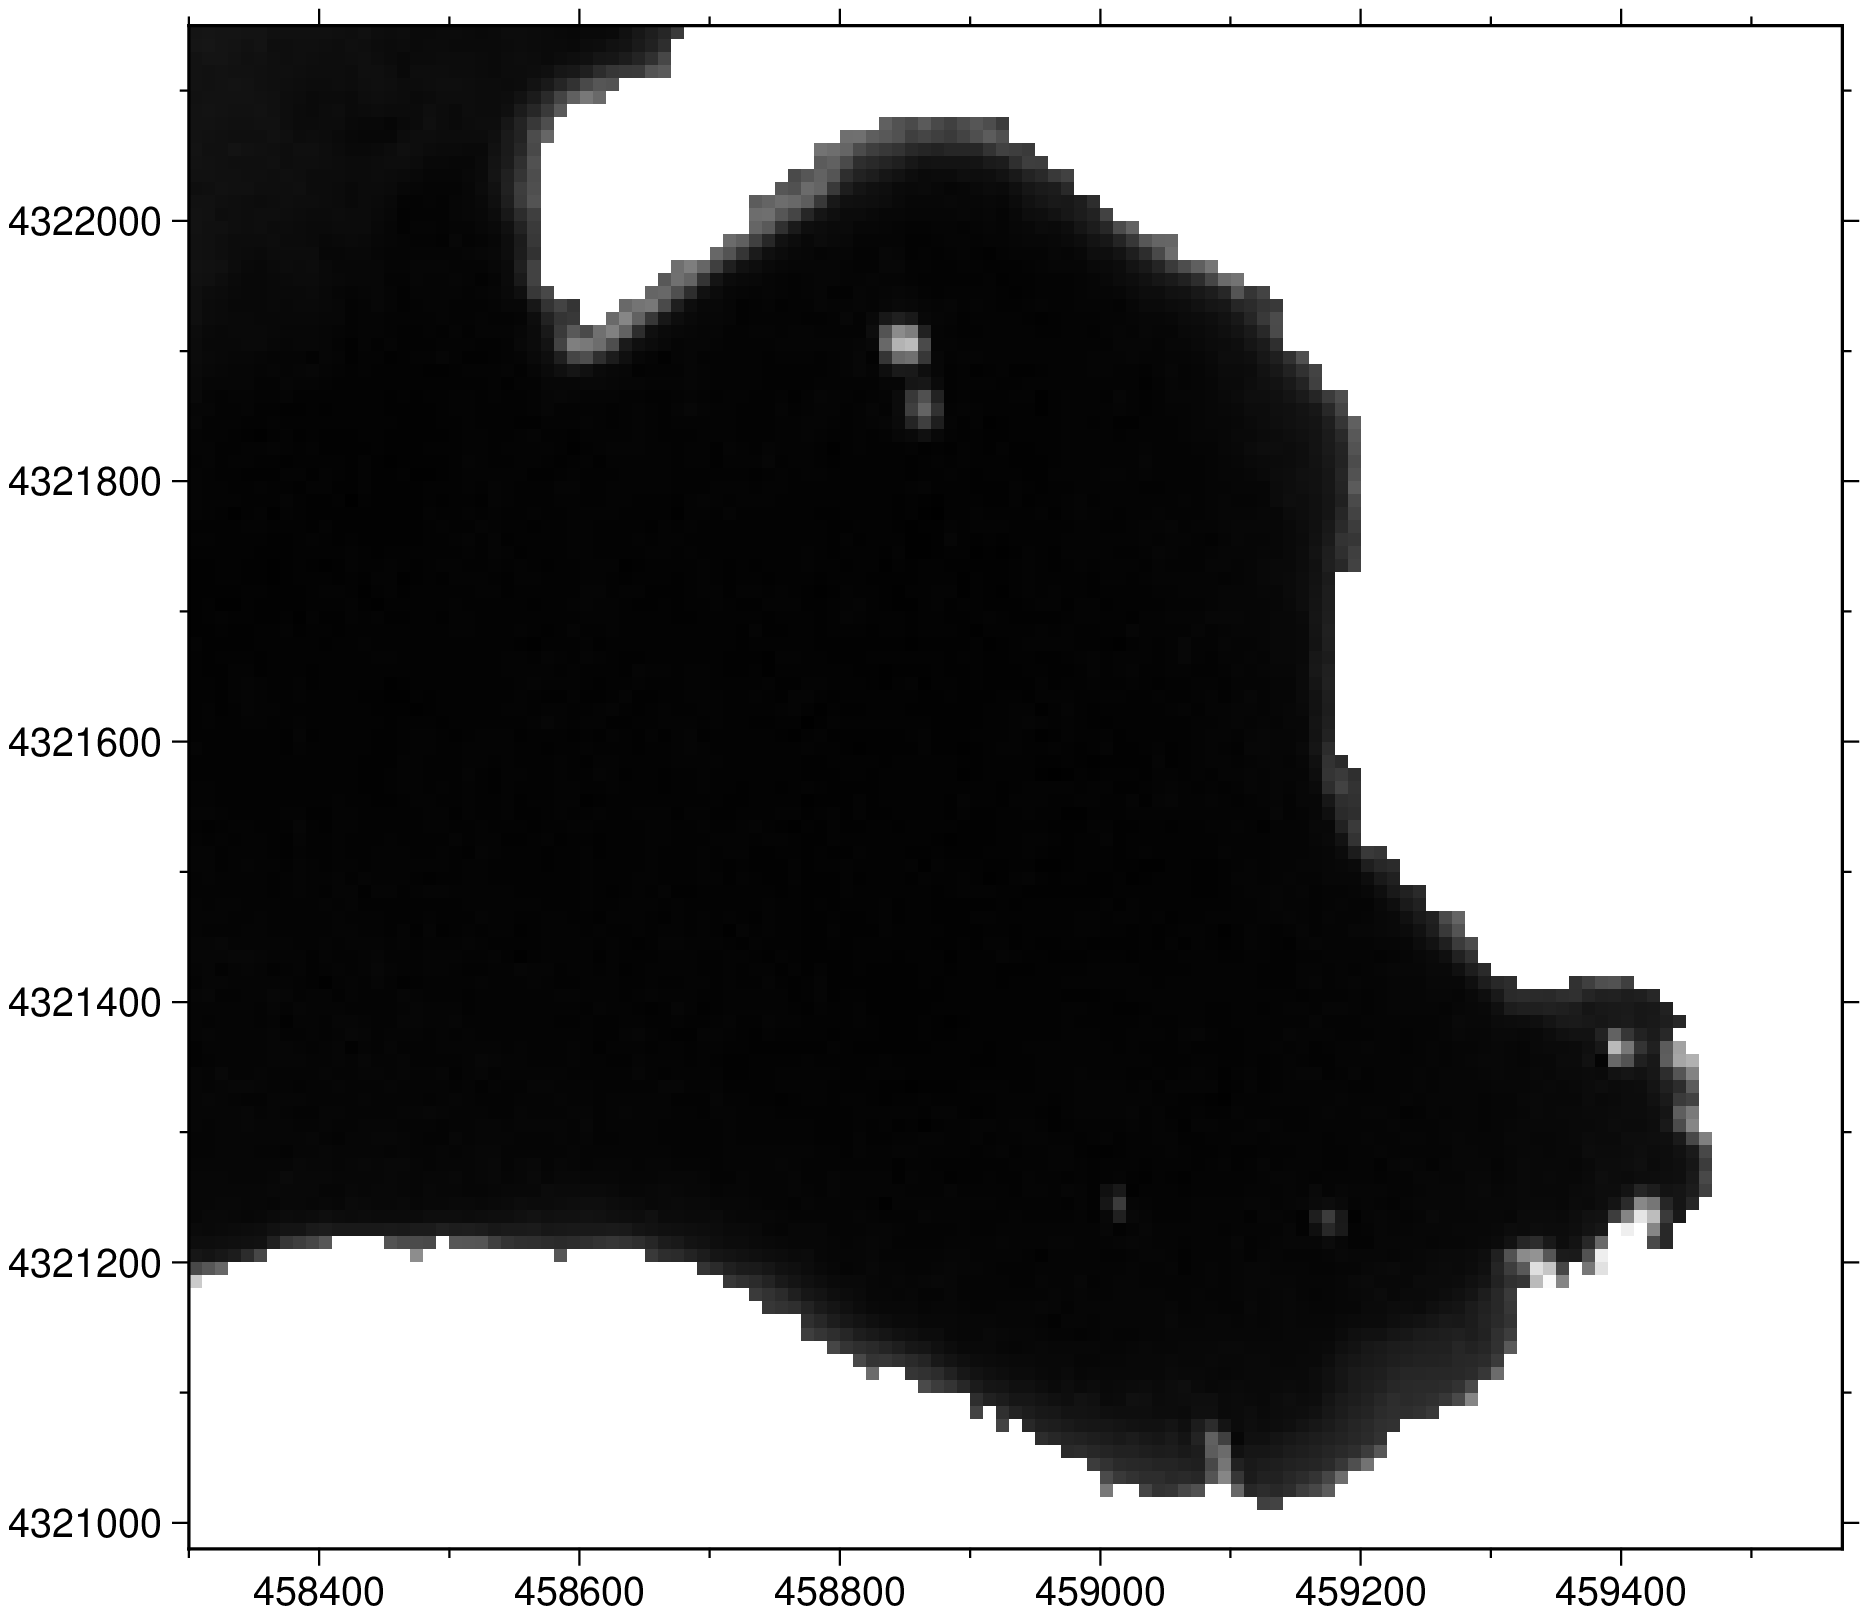
Yes, it’s better to continue this over an issue on RemoteS so please open one. But notice that your float grids have very little dynamic
v_min: 0.039468023926 v_max: 0.159227579832
and I’m guessing that the bright dots are due to clouds. Did you do a processing like the one explained in this tutorial? The histogram stretch step is an absolute must.
It turned out those were simple fixes (after finding the reason). The issue was that GMT accepts grids and images with several different memory layouts (row & column major, top-down or bottom-up, band-line-pixel interleaving) and you case was non consulting the original data layout. Those are now fixed and new versions released so please update both GMT and RemoteS
However, as I guessed above, your image is mostly all blacks. I suggest that you follow exactly that tutorial I mentioned above. Just replace the file names for your owns.
could you please point me out to the source code for the function that applies the stretching? It looks to do a better job than the ones defined here Any chance to have it in pure images package?
Sure, it’s in the GMT’s histogram module. Functions starting here
In a quick look it doesn’t seems to depend on other GMT code so it should be relatively easy to extract that functionality. But note that it only tries to do a clever pick of the histogram limits to apply the stretch and no histogram equalization. It’s a function specially tailored for UInt16 satellite data. The tutorial I pointed above has a nice example of what it does.
Yes, I’m interested just in the stretching part. I also have a lot of satellite imagery, unfortunately I had always have problems with the GMT package in my computer. But, this function in specific looks to do actually a really good job. Hence the question.
Edit: They also have LinearStretching maybe that one will do the trick for me.
I guess you are on Linux. Yes, the libstdc++ compatibility breaking has plagued the automatic installation for several months but it’s now solved. Also, recently libnetcdf and libcurl started to conflict in recent Linux distros. There is an open issue about it. If it is something else then please open issues.
I’m sure the RemoteS package would gain a lot from your expertise.
Your method also works for my example after some adjustments. However, when I try to apply some transparency to NaN pixels I get a black boundary line. Do you know how this can be removed without changing to white?
Here is the code if someone wants to use in the future:
# Packages
import ArchGDAL
import Images

# Read example bands
RedRaster = ArchGDAL.read("Red.tif");
RedRasterBand = ArchGDAL.getband(RedRaster, 1);
RedRasterData = Matrix(RedRasterBand);

GreenRaster = ArchGDAL.read("Green.tif");
GreenRasterBand = ArchGDAL.getband(GreenRaster, 1);
GreenRasterData = Matrix(GreenRasterBand);

BlueRaster = ArchGDAL.read("Blue.tif");
BlueRasterBand = ArchGDAL.getband(BlueRaster, 1);
BlueRasterData = Matrix(BlueRasterBand);

# Construct RGBA
RGBAimg = Matrix(Images.colorview(Images.RGBA, RedRasterData', GreenRasterData', BlueRasterData'));

# Apply transparency to NaNs - I think this can be improved
for i in 1:size(RGBAimg[:])[1]
    if isequal(RGBAimg[i], Images.RGBA{Float32}(NaN32,NaN32,NaN32,1.0f0))
        TempRGBAimg = RGBAimg[i]
        RGBAimg[i] = Images.RGBA{Float32}(TempRGBAimg.r, TempRGBAimg.g, TempRGBAimg.b, 0)
    else # Just to highlight black border
        TempRGBAimg = RGBAimg[i]
        RGBAimg[i] = Images.RGBA{Float32}(1, 0, 0, 1)
    end
end

# Resize image if needed
SizeF = 10
RGBAimgr = Images.imresize(RGBAimg, SizeF.*size(RGBAimg))