After the first call, the time from clicking “solve it” to having a new plot is ~550 ms, and this is with the entire back-end in a giant try … catch block and the front-end in development mode.
The big input is not sanitized yet, but it should be in decent shape if anyone wants to play around with it.
Hmm, where are you actually plotting it? Are you generating the plot in Plotly using the data you send back? The reason why I suggested using the plot recipe via Plots.jl + Plotly is because it handles thing like dense plotting, which makes those lines smoother, and will make it easy to do phase plots etc. Then you’d just have to send the Javascript back.
What I would add is, outside of the function call:
using Plots # need this earlier
plotly() # change the backend, this could be done outside of the function when Plots is instantiated
then in the function after solving, add
p = plot(sol)
jscript = # Somehow get the javascript for the plot out of the Plotly plot itself?
res = Dict("u" => sol.u, "t" => sol.t, "jscript" => jscript)
and directly display the plot from that Javascript. That will make it so that way all of the plotting work that we’re working on wouldn’t have to be recreated in Javascript itself.
Currently the plotting happens on the front-end here. It receives t and u from the back end and uses the Javascript version of Plotly in the client.
I don’t think we want to try to do the plotting on the back-end and pass some resulting object forward. I’m not sure runtime javascript injection is even possible with the front-end framework I’m using and I think it’s strongly discouraged in general due to security concerns. It also puts a larger burden on the back-end and increases the amount of data we have to shuttle back and forth.
I’m not familiar with Plots.jl – is it doing some sort of smoothing? If so, can we just send the resampled t and u to the client?
Edit: I guess the smoothing is done by the function interp that’s packaged into the solution. I’ll try returning a much-finer sampling of t and u instead of those that come in the solution.
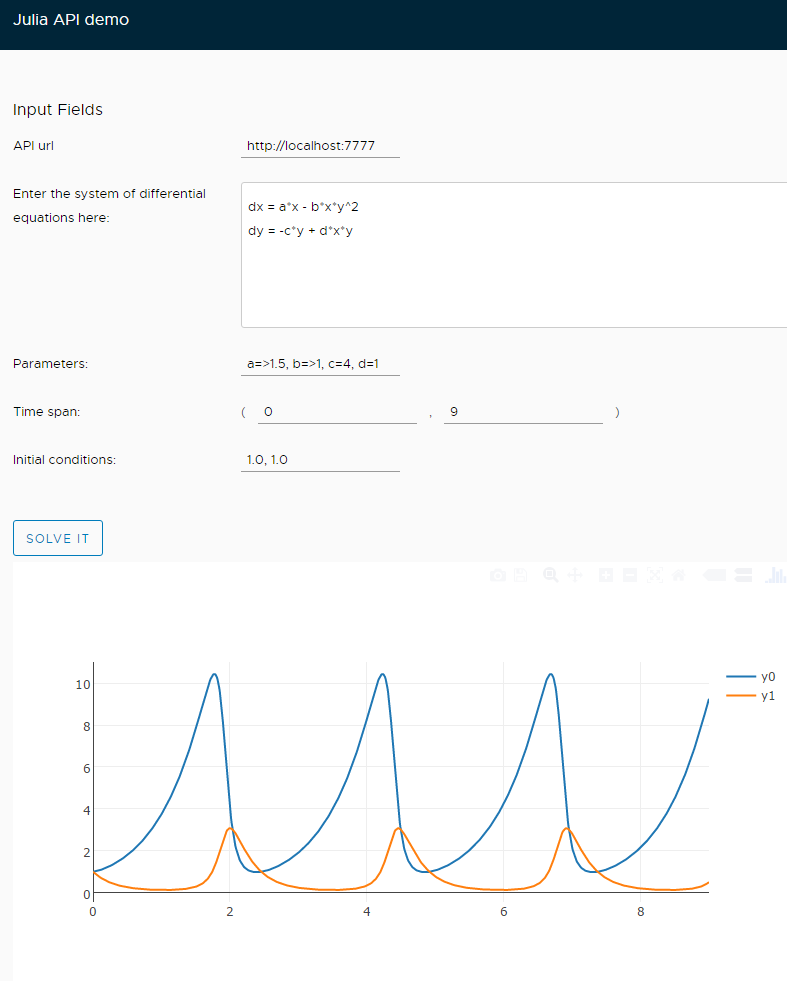
Edit2: This is what it looks like with 1k sample points:
Plotly has some representation for its plots, could we take that and send it over to the other Plotly? It has some way of sending the data over to its cloud server: is that something we can tap into?
I mean, the easiest way to do this simple case is to use the interpolation sol(t) at say 1000 points (sol.interp(t) is what’s called by sol(t)). But we have many improvements going on in plotting, so it would be nice to use them directly. For example, we have a way of choosing which coordinates to plot:
It seems this will soon be updated to even switch between 3D plots and everything, and Plots.jl makes it easy to do subplots. There’s also an algorithm for automatically choosing the number and location of points to plot in the works:
In the end, I think we’d have a lot of free flexibility if we let the Julia function control the plotting output since it’s getting a lot of work already.
Ah good catch, I think there’s probably a way to access the JSON
representation of the plot that PlotlyJS hands off to Plotly to actually do
the plotting. This JSON could be sent back to the client Plotly to recreate
the exact same plot.
(Please excuse brevity and errors, sent from a mobile device.)
While the full Javascript output was too large to show in the REPL (it just kept printing and printing…), the JSON is not bad at all. I think this is definitely the way to go.
The one big issue I encountered in the wild with clientside plotting (using plotly and shiny in R) is using boxplots. I think one wants to generate boxplots serverside unless the clientside has some way to use the precomputed stats, which plotly back then didn’t have (not sure about now). So one needed to send all the data around even though only some primitive shapes and some outliers are drawn. It froze my browser a couple of times until I switched to using ggplot instead.
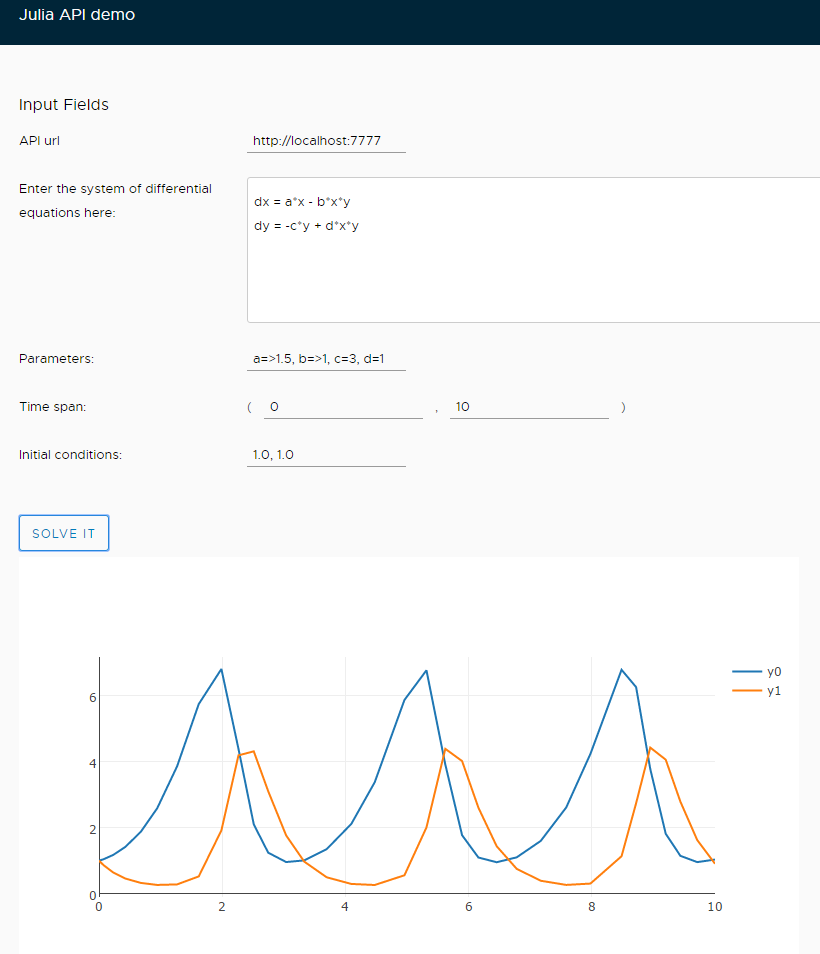
right? If so, the top one looks correct. Are you getting any errors on the browser console? It should also echo the returned response there so you can confirm that it looks right.
I fixed up the srvr.jl file. Now everything works and the plot is made, but it’s blank. It’s because layout and series seem to come back as strings. I need to interpret those strings as a JSON object. Do you know how to do that?
You’re getting a stringed version of the layout and series objects from Plotly, right? I bet it’s because the server takes the object you want to return and strings it again with JSON.json(). If they are already strings you may need to construct the final JSON string by hand with string interpolation.
Alright! I got it plotting the Plots.jl JSON. I updated the README to make it super noob friendly, so feel free to give it a try. One thing that really needs to be done now though is the plot window needs to be resized. @tbreloff does this via https://github.com/tbreloff/Plots.jl/blob/master/src/backends/plotly.jl#L641 . Using the JSON directly makes a plot which is too big for the default Window:
The size of the plot div can be set statically here or it could be adjusted programatically by binding those values in Angular 2. I don’t know how well it works with Plotly, but we could also make the plot resizable by the user.
Any stylings from Plots.jl that you want to override can be done client side with something like Object.assign(this.resultsObj, {layout: {xaxis: {title: 't'}}, or done on the server.
I don’t want to belabor the point since this is your party, but if we can capture the styling decisions that are being made by Plots.jl I still think it would be best to apply them client side and just pass the data. Even on my beefy computer, the request to the server takes more than 2 sec to resolve for a new problem now. This may work for now, but if we want to make this publicly available it will be running in a container on a wet noodle of a VM.
Is passing the JSON the problem, or passing the points? I would think that since by default I have it passing back 1000 points (const numpoints = 1000) that would be the bigger issue. What happens when that is knocked down? I am running it from a very beefy computer so I don’t really see a cost for the request.
If this doesn’t knock it down, what we can do is refactor the plotting tools so that way to points and labels for the plots could be computed without producing the plot, and then sent over and plotted on the client side.
Looking at this more closely, it looks like I timed it incorrectly yesterday – after the first run solving is taking about 1.7 sec, and the call to plot is ~0.2 sec, so it’s not actually expensive and is probably fine if you want to do it server-side. Sorry for the confusion!
Cool. It sounds like this is definitely doable, and there are some things that may need to get streamlined (we’re working on getting ParameterizedFunctions.jl precompiled and not have to use any evals (almost got it last night), and getting 1000 interpolated points has a higher cost than it should, but that’s fixed on v0.6 by broadcast fusion).
We could probably just have it match Plots.jl’s default size for now. I’ll do that when I get back.
Is there a way to link the gh-pages render to a Julia process? No, right?
Not quite sure what you’re asking, but probably not. All gh-pages does is statically serve contents of that branch, and if a request goes to a file that doesn’t exist, serve 404.html instead (this last bit is crucial to getting Angular 2 apps to work).