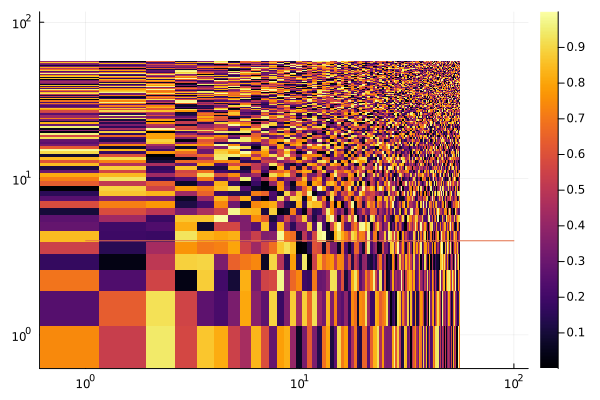
I want to add a reference line to a heatmap and am currently doing it as follows:
using Plots
plot1 = heatmap(1:100, 1:100, rand(100, 100), scale=:log10)
plot!(plot1, 1:100, ones(100) .* 4, label="")
This works but somehow squeezes the heatmap so that blank areas appear at top and right. Using any scale or only x/yscale leads the same issue. Is there any way around this problem?