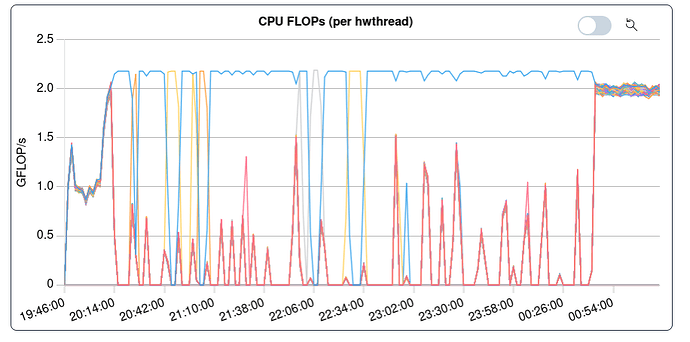
I have some Julia (1.10.10) code that I am benchmarking on a HPC cluster node with 76 physical cores, running with 76 threads, and I am seeing HUGE variability between runs with everything equal (same hardware, same code, same libraries, everything).
This is the performance per thread, averaged on a 30sec period, of a “good” run:
And here is the same, for a “bad” run (which lasts ~5x longer, doing the same things):
Where there is mostly only one thread working.
Notice that at the beginning and at the end for some reason all the threads do some work.
The code uses multithreading, with many Threads.@threads invocations, but there is a loop where the cost of every iteration has a different computational cost, and there, to tackle load balancing issues, it was decided to use dynamic scheduling by spawning one task per iteration (in total, 2500 tasks) in a @sync block.
Since that is the only place where things are not reproducible, I was led to conclude that the use of @spawn might be the culprit.
The sync/@spawn block, sligtly amended for clarity, reads:
# Creating a channel with a the same number of elements as there are threads:
BufferChannel1 = Channel{T}(Threads.nthreads())
for buff in [BufferType() for _ in 1:Threads.nthreads()]
    put!(BufferChannel1, buff)
end

# same for BufferChannel2
[...]

@sync begin
    for is in 1:50, it in 1:50
        Threads.@spawn begin
        Buffer1 = take!(BufferChannel1)
        Buffer2 = take!(BufferChannel2)

        for w = -lenIntw:lenIntw-1 # Matsubara sum
            f!(Buffer1, w, w + is)
            for iu in iurange
                g!(X, State, Par, is, it, iu, w, Buffer1)
                if (iu <= it)
                    h!(X, State, Par, is, it, iu, w, Buffer1, Buffer2)
                end
            end
        end
        put!(BuffersChannel1, Buffer1)
        put!(BuffersChannel2, Buffer2)
    end
end
So, my question to you are:
- Is it possible that this code causes the two activity patterns seen in the figures?
- If so, how? I would naively assume that a thread would start only one task at a time, but I guess that if the current task yields (perhaps at
take!orput!?) then the thread could start another task which might yield at the same point, and so on? Could it be that the locks for the channels and the locks for the task interfere somehow causing serialization?

