The question below was already raised at This post.
This code
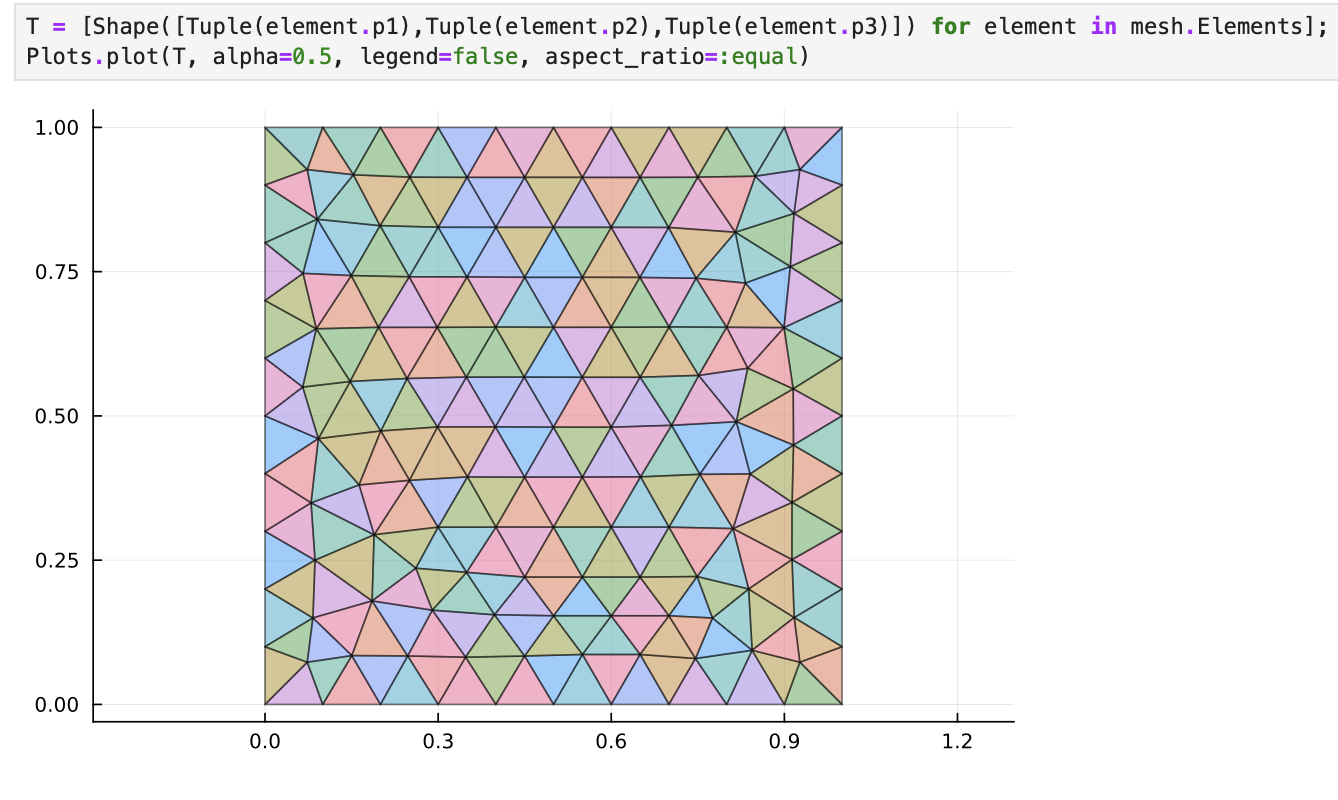
using Plots

function foo()

    #..Initialize the plot..
    p = plot()

    return p
end

function gnu()

    #..Initialize the plot..
    p = plot()::Plots.Plot{Plots.GRBackend}

    # return p
end
yields the output
@code_warntype foo()
MethodInstance for foo()
  from foo() @ Main In[14]:3
Arguments
  #self#::Core.Const(foo)
Locals
  p::Plots.Plot
Body::Plots.Plot
1 ─     (p = Main.plot())
└──     return p
In the target application, Plots.plot is called inside a for-loop over elements in a array. See function plotMesh below. The array is typically large. The function appears to be slow.
Possibly the code design is faulty to start with. Not sure whether an in-place version, a plotting recipe or an alternative is more appropriate here.
Please advice.
function plotMesh(mesh::Mesh)

    #..Initialize the plot..
    p = Plots.plot(xlabel = "x", ylabel = "y",legend = false,aspect_ratio = :equal)

    #..loop over number of elements..
    for element in mesh.Elements
        triangle = Shape([Tuple(element.p1),Tuple(element.p2),Tuple(element.p3)])
        p = Plots.plot!(p,triangle,fillcolor=:blue, alpha=0.7, linecolor=:black)
    end

    Plots.plot(p)

    return p
end
You can put the loop in a separate function to utilize a function barrier:
function plotloop!(p, Elements)
    for element in Elements
        triangle = ...
        Plots.plot!(p, triangle, ...)
    end
end

function plotMesh(mesh::Mesh)
    p = Plots.plot(xlabel, ...)
    plotloop!(p, mesh.Elements)
    ...
end
In this way there is a single instability inside plotMesh, but inside plotloop! there is no instability since the type of p is fully known when plotloop! is called. (Note that it’s not necessary to reassign p in p = Plots.plot!(p, ...) since plot! returns the original p, but updated.)
Edit: on second thought, plot! is not specializing on the plot type, so this may not help a lot. It could be that the slowness are from something else, like garbage collection due to the many vectors created when you construct the Shape.
The code below continues to be slow due to many allocations.
function plotloop!(p,mesh::Mesh)
    #..loop over number of elements..
    for element in mesh.Elements
        triangle = Shape([Tuple(element.p1),Tuple(element.p2),Tuple(element.p3)])
        Plots.plot!(p,triangle,fillcolor=:blue, alpha=0.7, linecolor=:black)
    end
    return p
end

function plotMesh(mesh::Mesh)

    #..Initialize the plot..
    p = Plots.plot(xlabel = "x", ylabel = "y",legend = false,aspect_ratio = :equal)

    plotloop!(p, mesh)

    Plots.plot(p)

    return p
end