I think I would just abandon the use of the macro in this case. Does this do what you want?
using DataFrames
using StatsPlots
df = DataFrame(
supplier_A=rand(0:20, 30),
consumer_A=rand(0:20, 30),
supplier_B=rand(0:20, 30),
consumer_B=rand(0:20,30)
)
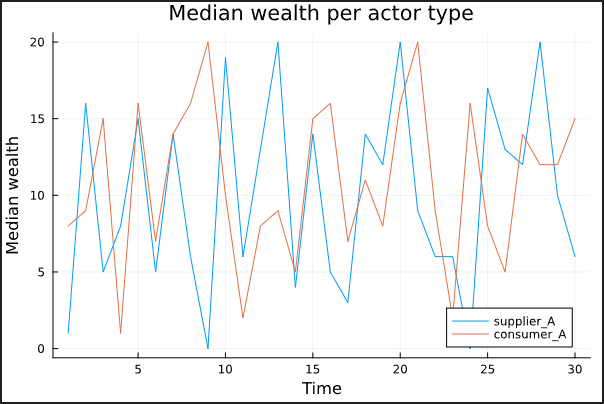
function plot_type_wealth(df, cols)
plot(
[df[!, col] for col in cols],
label=reshape([string(col) for col in cols], 1, length(cols)),
title="Median wealth per actor type",
xlabel="Time",
ylabel="Median wealth"
)
end
plot_type_wealth(df, [:supplier_A, :consumer_A])