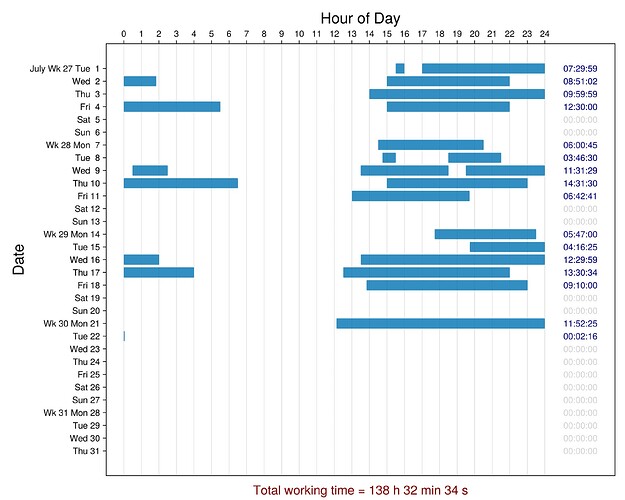
I am trying to replicate a plot from timewarrior that looks something like this:
Basically, you have date on the y-axis and blocks of time on the x-axis from 0 - 23 representing 24 hours in a day. I don’t care about showing the total time or week counts; only the y-axis, x-axis, and blocks of time per day in the plot.
So far, I have data that looks like this in a DataFrame:
julia> days
40×2 DataFrame
 Row │ start                      stop
     │ ZonedDat…                  ZonedDat…
─────┼──────────────────────────────────────────────────────
   1 │ 2025-07-01T15:30:00-04:00  2025-07-01T16:00:00-04:00
   2 │ 2025-07-01T17:00:00-04:00  2025-07-01T23:59:59-04:00
   3 │ 2025-07-02T00:00:00-04:00  2025-07-02T01:51:02-04:00
   4 │ 2025-07-02T15:00:00-04:00  2025-07-02T22:00:00-04:00
   5 │ 2025-07-03T14:00:00-04:00  2025-07-03T23:59:59-04:00
   6 │ 2025-07-04T00:00:00-04:00  2025-07-04T05:30:00-04:00
   7 │ 2025-07-04T15:00:00-04:00  2025-07-04T22:00:00-04:00
And for copy-paste-able purposes, here is a version of it in a Matrix:
using TimeZones

days = [ZonedDateTime(2025, 7, 1, 15, 30, tz"America/New_York") ZonedDateTime(2025, 7, 1, 16, tz"America/New_York"); ZonedDateTime(2025, 7, 1, 17, tz"America/New_York") ZonedDateTime(2025, 7, 1, 23, 59, 59, tz"America/New_York"); ZonedDateTime(2025, 7, 2, tz"America/New_York") ZonedDateTime(2025, 7, 2, 1, 51, 2, tz"America/New_York"); ZonedDateTime(2025, 7, 2, 15, tz"America/New_York") ZonedDateTime(2025, 7, 2, 22, tz"America/New_York"); ZonedDateTime(2025, 7, 3, 14, tz"America/New_York") ZonedDateTime(2025, 7, 3, 23, 59, 59, tz"America/New_York"); ZonedDateTime(2025, 7, 4, tz"America/New_York") ZonedDateTime(2025, 7, 4, 5, 30, tz"America/New_York"); ZonedDateTime(2025, 7, 4, 15, tz"America/New_York") ZonedDateTime(2025, 7, 4, 22, tz"America/New_York"); ZonedDateTime(2025, 7, 5, tz"America/New_York") ZonedDateTime(2025, 7, 5, tz"America/New_York"); ZonedDateTime(2025, 7, 6, tz"America/New_York") ZonedDateTime(2025, 7, 6, tz"America/New_York"); ZonedDateTime(2025, 7, 7, 14, 30, tz"America/New_York") ZonedDateTime(2025, 7, 7, 20, 30, 45, tz"America/New_York"); ZonedDateTime(2025, 7, 8, 14, 45, tz"America/New_York") ZonedDateTime(2025, 7, 8, 15, 30, 45, tz"America/New_York"); ZonedDateTime(2025, 7, 8, 18, 30, tz"America/New_York") ZonedDateTime(2025, 7, 8, 21, 30, 45, tz"America/New_York"); ZonedDateTime(2025, 7, 9, 0, 30, tz"America/New_York") ZonedDateTime(2025, 7, 9, 2, 30, 45, tz"America/New_York"); ZonedDateTime(2025, 7, 9, 13, 30, tz"America/New_York") ZonedDateTime(2025, 7, 9, 18, 30, 45, tz"America/New_York"); ZonedDateTime(2025, 7, 9, 19, 30, tz"America/New_York") ZonedDateTime(2025, 7, 9, 23, 59, 59, tz"America/New_York"); ZonedDateTime(2025, 7, 10, tz"America/New_York") ZonedDateTime(2025, 7, 10, 6, 30, 45, tz"America/New_York"); ZonedDateTime(2025, 7, 10, 15, tz"America/New_York") ZonedDateTime(2025, 7, 10, 23, 0, 45, tz"America/New_York"); ZonedDateTime(2025, 7, 11, 13, tz"America/New_York") ZonedDateTime(2025, 7, 11, 19, 42, 41, tz"America/New_York"); ZonedDateTime(2025, 7, 12, tz"America/New_York") ZonedDateTime(2025, 7, 12, tz"America/New_York"); ZonedDateTime(2025, 7, 13, tz"America/New_York") ZonedDateTime(2025, 7, 13, tz"America/New_York"); ZonedDateTime(2025, 7, 14, 17, 43, 34, tz"America/New_York") ZonedDateTime(2025, 7, 14, 23, 30, 34, tz"America/New_York"); ZonedDateTime(2025, 7, 15, 19, 43, 34, tz"America/New_York") ZonedDateTime(2025, 7, 15, 23, 59, 59, tz"America/New_York"); ZonedDateTime(2025, 7, 16, tz"America/New_York") ZonedDateTime(2025, 7, 16, 2, 0, 34, tz"America/New_York"); ZonedDateTime(2025, 7, 16, 13, 30, 34, tz"America/New_York") ZonedDateTime(2025, 7, 16, 23, 59, 59, tz"America/New_York"); ZonedDateTime(2025, 7, 17, tz"America/New_York") ZonedDateTime(2025, 7, 17, 4, 0, 34, tz"America/New_York"); ZonedDateTime(2025, 7, 17, 12, 30, 34, tz"America/New_York") ZonedDateTime(2025, 7, 17, 22, 0, 34, tz"America/New_York"); ZonedDateTime(2025, 7, 18, 13, 50, 34, tz"America/New_York") ZonedDateTime(2025, 7, 18, 23, 0, 34, tz"America/New_York"); ZonedDateTime(2025, 7, 19, tz"America/New_York") ZonedDateTime(2025, 7, 19, tz"America/New_York"); ZonedDateTime(2025, 7, 20, tz"America/New_York") ZonedDateTime(2025, 7, 20, tz"America/New_York"); ZonedDateTime(2025, 7, 21, 12, 7, 34, tz"America/New_York") ZonedDateTime(2025, 7, 21, 23, 59, 59, tz"America/New_York"); ZonedDateTime(2025, 7, 22, tz"America/New_York") ZonedDateTime(2025, 7, 22, 0, 2, 16, tz"America/New_York"); ZonedDateTime(2025, 7, 23, tz"America/New_York") ZonedDateTime(2025, 7, 23, tz"America/New_York"); ZonedDateTime(2025, 7, 24, tz"America/New_York") ZonedDateTime(2025, 7, 24, tz"America/New_York"); ZonedDateTime(2025, 7, 25, tz"America/New_York") ZonedDateTime(2025, 7, 25, tz"America/New_York"); ZonedDateTime(2025, 7, 26, tz"America/New_York") ZonedDateTime(2025, 7, 26, tz"America/New_York"); ZonedDateTime(2025, 7, 27, tz"America/New_York") ZonedDateTime(2025, 7, 27, tz"America/New_York"); ZonedDateTime(2025, 7, 28, tz"America/New_York") ZonedDateTime(2025, 7, 28, tz"America/New_York"); ZonedDateTime(2025, 7, 29, tz"America/New_York") ZonedDateTime(2025, 7, 29, tz"America/New_York"); ZonedDateTime(2025, 7, 30, tz"America/New_York") ZonedDateTime(2025, 7, 30, tz"America/New_York"); ZonedDateTime(2025, 7, 31, tz"America/New_York") ZonedDateTime(2025, 7, 31, tz"America/New_York")]
I have been trying to figure out how to plot this type of gapped time series data in a barplot using inspiration from the Makie.jl documentation on creating gantt charts. Here is what I have tried so far:
using TimeZones
using CairoMakie
using DataFrames
using Dates

f = Figure(resolution = (1000, 800));
ax = Axis(f[1, 1];
    xlabel = "Hour of Day",
    ylabel = "Date",
    xticks = 0:1:23,
    yreversed = true # earliest date at top
);

# Not sure the proper invocation
barplot!(ax, 0:39, DateTime.(days.stop), fillto = DateTime.(days.start))
But I can’t seem to quite figure out the proper way to plot this data… I am not sure exactly how to fillto correctly and how to make these gaps appear. I seemingly keep getting errors regarding isless (copied below in post-script). Could anyone help me with this?
Thanks!
~ tcp ![]()
P.S. Here is an example error I get:
julia> barplot!(ax, 0:39, DateTime.(days.stop), fillto = DateTime.(days.start))
ERROR: MethodError: no method matching isless(::Float64, ::DateTime)
The function `isless` exists, but no method is defined for this combination of argument types.

Closest candidates are:
  isless(::Missing, ::Any)
   @ Base missing.jl:87
  isless(::Any, ::Missing)
   @ Base missing.jl:88
  isless(::AbstractFloat, ::Union{StatsBase.PValue, StatsBase.TestStat})
   @ StatsBase ~/.julia/packages/StatsBase/s2YJR/src/statmodels.jl:100
  ...

Stacktrace:
  [1] min(x::DateTime, y::Float64)
    @ Base ./operators.jl:499
  [1] min(x::DateTime, y::Float64)
    @ Base ./operators.jl:499
  [2] bar_rectangle(x::Float64, y::Float64, width::Float64, fillto::DateTime, in_y_direction::Bool)
    @ ./broadcast.jl:678 [inlined]
  [4] _broadcast_getindex
    @ ./broadcast.jl:651 [inlined]
  [5] getindex
    @ ./broadcast.jl:610 [inlined]
  [6] copy
    @ ./broadcast.jl:911 [inlined]
  [7] materialize
    @ ./broadcast.jl:872 [inlined]
  [8] (::Makie.var"#calculate_bars#892"{…})(xy::Vector{…}, fillto::Vector{…}, offset::Float64, transformation::Tuple{…}, width::
Makie.Automatic, dodge::Makie.A
utomatic, n_dodge::Makie.Automatic, gap::Float64, dodge_gap::Float64, stack::Makie.Automatic, dir::Symbol, bar_labels::Nothing,
flip_labels_at::Float64, label_
color::Symbol, color_over_background::Makie.Automatic, color_over_bar::Makie.Automatic, label_formatter::typeof(Makie.bar_label_
formatter), label_offset::Int64
, label_rotation::Float64, label_align::Makie.Automatic, label_position::Symbol)
    @ Makie ~/.julia/packages/Makie/6zcxH/src/basic_recipes/barplot.jl:335
  [9] map(::Makie.var"#calculate_bars#892"{…}, ::Union{…}, ::ComputePipeline.Computed, ::ComputePipeline.Computed, ::Vararg{…};
ignore_equal_values::Bool, priority::Int64)
    @ Makie ~/.julia/packages/Makie/6zcxH/src/scenes.jl:200
 [10] map
    @ ~/.julia/packages/Makie/6zcxH/src/scenes.jl:195 [inlined]
 [11] plot!(p::BarPlot{Tuple{Vector{Point{2, Float64}}}})
    @ Makie ~/.julia/packages/Makie/6zcxH/src/basic_recipes/barplot.jl:338
 [12] connect_plot!(parent::Scene, plot::BarPlot{Tuple{Vector{Point{2, Float64}}}})
    @ Makie ~/.julia/packages/Makie/6zcxH/src/compute-plots.jl:805
 [13] plot!
    @ ~/.julia/packages/Makie/6zcxH/src/interfaces.jl:211 [inlined]
 [14] plot!(ax::Axis, plot::BarPlot{Tuple{Vector{Point{2, Float64}}}})
    @ Makie ~/.julia/packages/Makie/6zcxH/src/figureplotting.jl:431
 [15] _create_plot!(::Function, ::Dict{Symbol, Any}, ::Axis, ::UnitRange{Int64}, ::Vararg{Any})
    @ Makie ~/.julia/packages/Makie/6zcxH/src/figureplotting.jl:401
 [16] barplot!(::Axis, ::Vararg{Any}; kw::@Kwargs{fillto::Vector{DateTime}})
    @ Makie ~/.julia/packages/Makie/6zcxH/src/recipes.jl:521


