Saved .png/.pdf shows title on top of plot

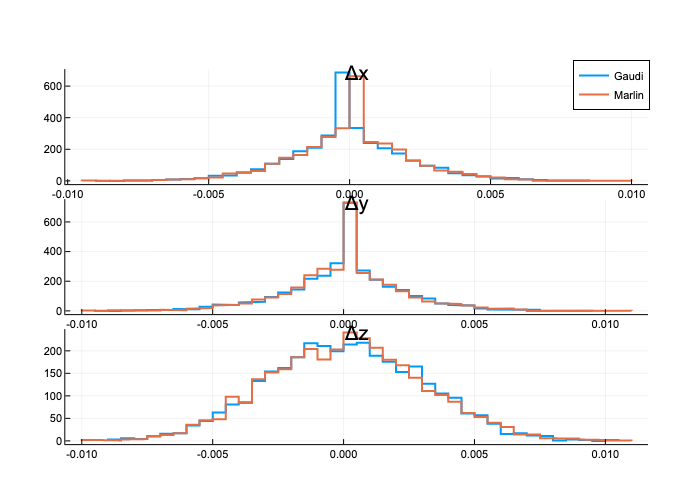
With Plots v1.39.0 on a MacOS arm 14.2, when saving plots (histograms) as .png or .pdf I get a different figure where the title is put on top of the plot. I am using the following code to plot:

    lay = @layout [°;°;°]
    plot(layout=lay, show=true, size=(1200,1000))
    for (i,l) in enumerate(fieldnames(eltype(new_dist)))
        stephist!(getfield.(new_dist, l), subplot=i, title="Δ$(l)", linewidth=2, label= i==1 ? "Gaudi" : nothing)
        stephist!(getfield.(old_dist, l), subplot=i, linewidth=2, label=i==1 ? "Marlin" : nothing)
    end

The result on the screen looks like this:


while the saved file is like this:

Is there anyway to avoid this? Thanks.

Probably using the margin keyword, something like plot!(margin = 0.5Plots.cm). (or topmargin and/or bottommargin).

Thanks.
Yes, it works much better. But there is still a difference between the saved figure and the on screen one.

seems like a potential bug in Plots.jl, can you reproduce it with smaller example?

I think I agree that this is worth filing an Issue on GitHub over. Even better if you can include a MWE so it can be easily reproduced by somebody trying to fix it. My prior assumption going-in would that what is displayed by a plot call is the same as what gets saved by savefig, and I don’t see anything glaring in the docs here or here that would caution me otherwise.

Done. [BUG] Saved .png/.pdf shows title on top of plot · Issue #4851 · JuliaPlots/Plots.jl · GitHub

1 Like