[Edit: the package is registered]
CasualPlots.jl (interim name, but actually I like it) aims to provide a GUI to simplify the creation of plots in Julia. The tool is positioned in the middle ground between purely script-based plotting and standalone GUI plotting applications, like e.g. Origin or Veusz.
The intended user is a casual Julia user, e.g. an experimental scientist or a “hands-on” engineer - for whom it could become an alternative to using Excel🤢 for plotting. The intention is to provide like 60..80% of features commonly expected by that kind of user. It will be limited only to the most common of 2D-Plots (scatter and line plots to start with). The GUI-available features should be mostly sufficient to produce typical plots for e.g. internal presentations, however with the option to apply fine tuning manually to the GUI-produced plot afterwards.
What it is not: In now way the intention is to compete with any “serious” tools in terms of the features scope. It is also probably not that interesting to a Julia developer who uses Julia day in and day out from Emacs or Vim and knows every Makie parameter by heart.
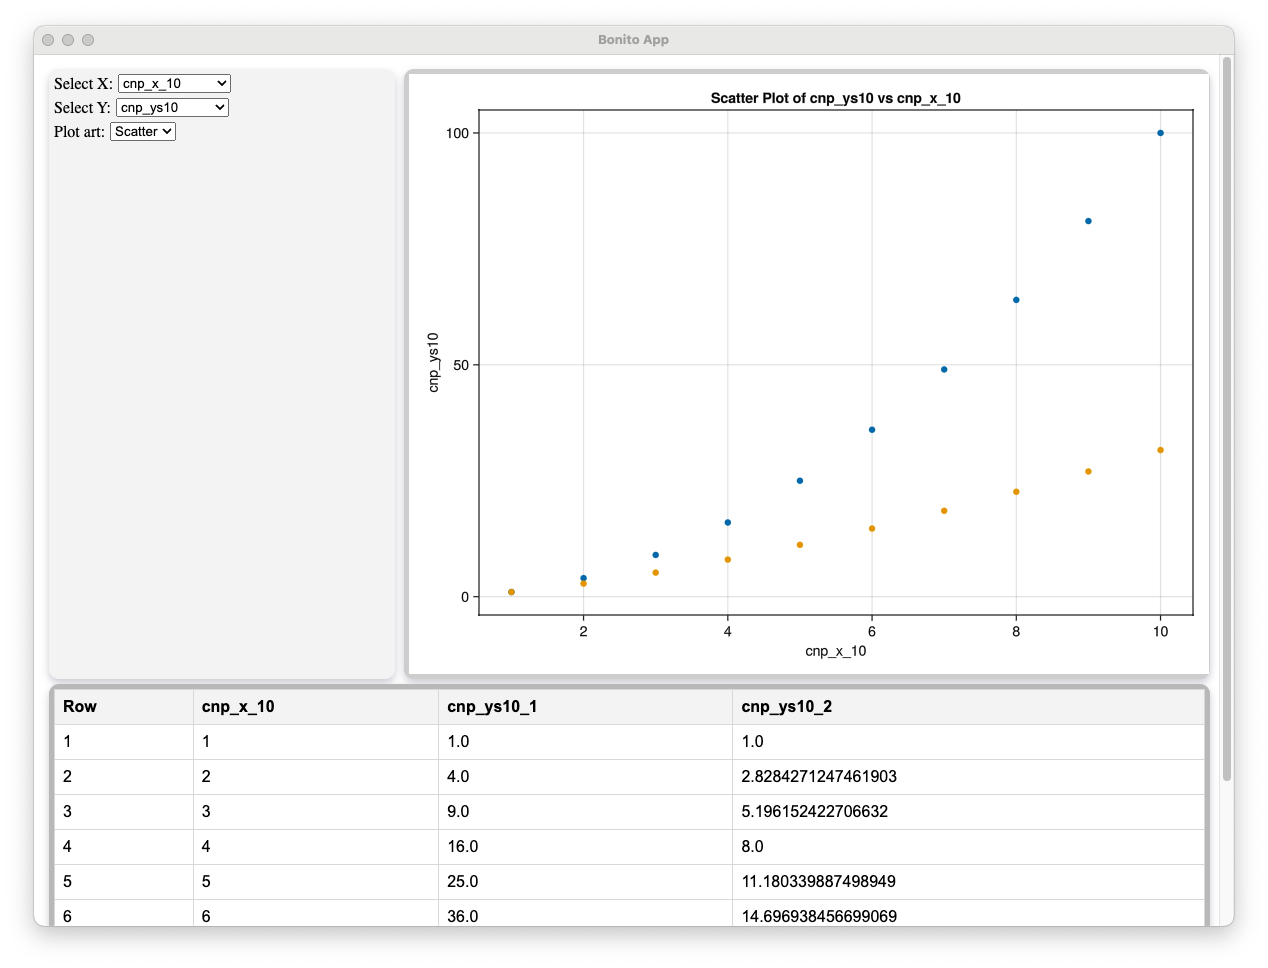
The package usage is as follows: From the command line (or script) user would start a GUI, where they can select data sources. As soon as the X and Y data sources are selected, both the plot, and the data in tabular form, will be displayed. Simultaneously, the corresponding Figure object will be exported into the Main, giving the user the opportunity to do fine-tuning by hand.
The package is based on Bonito.jl, Makie.jl, and AlgebraOfGraphics.jl; Electron.jl window currently used for display.
Planned (and in a small part already implemented) features are:
- A GUI including panes to
- select data sources and configure plot features,
- display the plot,
- display the source data in tabular form.
- Data sources can be
- variables defined in the
Mainmodule (vectors, matrices, dataframes), - files which can be read into a DataFrame.
- variables defined in the
- Saving plot to a file.
- Exporting the
Figureobject, making it possible to set parameters not available in the GUI. - Automatic generation of Julia code corresponding to the user’s actions in the GUI. This allows users to reuse and modify the generated code.
- (Possibly) Applying a least-squares fit from the GUI.
The project is in very early stage, just a couple of days of Gemini-coding. Any suggestions, any critique are highly welcome! And, of course, should any come with a better name - it will be considered ![]()
Despite being in its infancy, you can already test it. See the file /src/scripts/three_panes.jl in the repository for code and instructions.