On Julia 1.11.4, Plots v1.40.11
MWE :
using Plots
xs = Float64[1,2,3,4]
ys = Float64[1,2,3,4,5,6,7,8]
zs = xs'./10 .+ ys
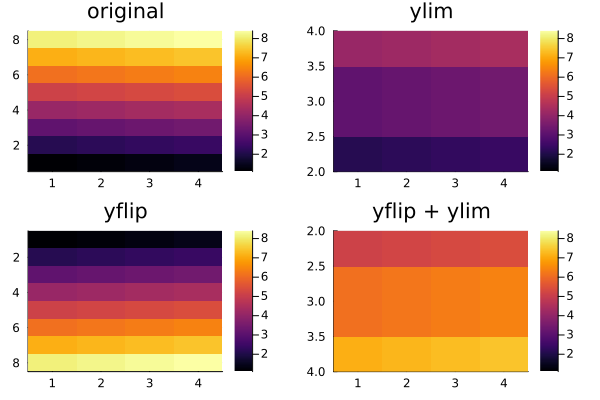
p1 = heatmap(xs, ys, zs, title = "original")
p2 = heatmap(xs, ys, zs, ylims = (2,4), title = "ylim")
p3 = heatmap(xs, ys, zs, yflip = true, title = "yflip")
p4 = heatmap(xs, ys, zs, ylims = (2,4), yflip = true, title = "yflip + ylim")
plot(p1, p2, p3, p4)
Shouldn’t the bottom right be the flipped of the top right, unless I’m missing something very obvious? The axes limits are fine but the values are off.