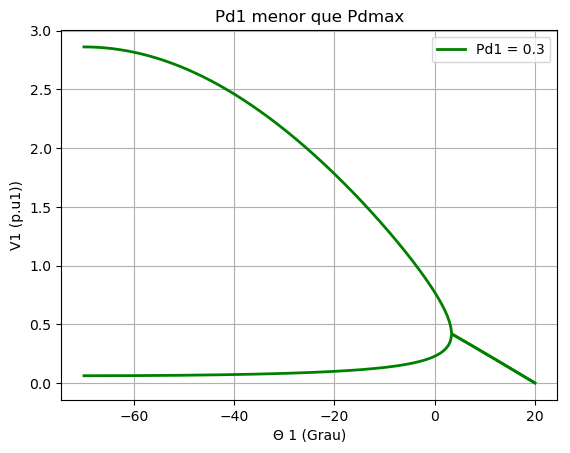
Hi, I need to plot a function/array that have complex number. This complex number are giving bad results to my graphic, as you can see in the image a line keep going in the corner of the Ellipsoid, this line is not welcome.
In order to fix it a need to filter the array V1a and V1b, excluding all elements that have imaginary part. I try to use V = real(V1a), but it do not work beacause it keep the element and I do not want to plot any element that used to have imaginary part.
Some have any idea how to help me?
image:
code:
using PyPlot
c = [“red”, “green”, “blue”, “black”, “gray”,“violet”, “orange”,“purple”,“yellow”, “Grey”,“Aqua”,“Black”,“BlueViolet”,“Brown”,“Coral”,“Cyan”,“Gold”,“Indigo”,“Lime”,“Magenta”,“Maroon” ];
(n,)=size(c)
θ1 = linspace(-70,20,1000);
αt = 70*(pi/180) # 70 graus height=“453”>(θ1*(pi/180)+ αt))+sqrt(((cos(θ1*(pi/180) + αt)).^(2.0))-(4.0cos(αt)Pd1Zt)+0im))/(2.0cos(αt))
V1b = ((+cos(θ1*(pi/180) + αt))-sqrt(((cos(θ1*(pi/180) + αt)).^(2.0))-(4.0cos(αt)Pd1Zt)+0im))/(2.0cos(αt))
plot(θ1, V1a, linewidth=2.0,color=c[2],label = “Pd1 = " *string(trunc(Pd1,2)), linestyle=”-“)
plot(θ1, V1b, linewidth=2.0,color=c[2], linestyle=”-")
PyPlot.xlabel(“Θ 1 (Grau)”)
PyPlot.ylabel(“V1 (p.u1))”)
PyPlot.title(“Pd1 menor que Pdmax”)
PyPlot.grid(“on”)
get the current axis argument of the plot
ax = gca()
ax[:legend](loc=“upper right”)
Thanks a lot