Given that this is intended master course material, Plots.jl would be neat, as it used in previous exercises. I am, however, open to alternatives. Many thx.
I have no idea of what you are asking or what you are trying to accomplish. Maybe you can find the functionality you want here Colormaps and Colorscales · Colors. If so, then you can probably skip the step in my code above (which is what I thought you originally asked about) and see seriescolor at Series Attributes · Plots.
I am looking to post-process the results of two-dimensional finite element computations on a triangular grid. Having solved Laplacian(u) = f for u using linear finite elements, Gradient(u) is constant on each element. I am thus looking to plot Gradient(u) on each element.
@ziolai I know you are mostly interested in Plots.jl solutions, but since you mentioned the challenge with large sets of triangles, consider the following alternative:
using Meshes
import GLMakie as Mke
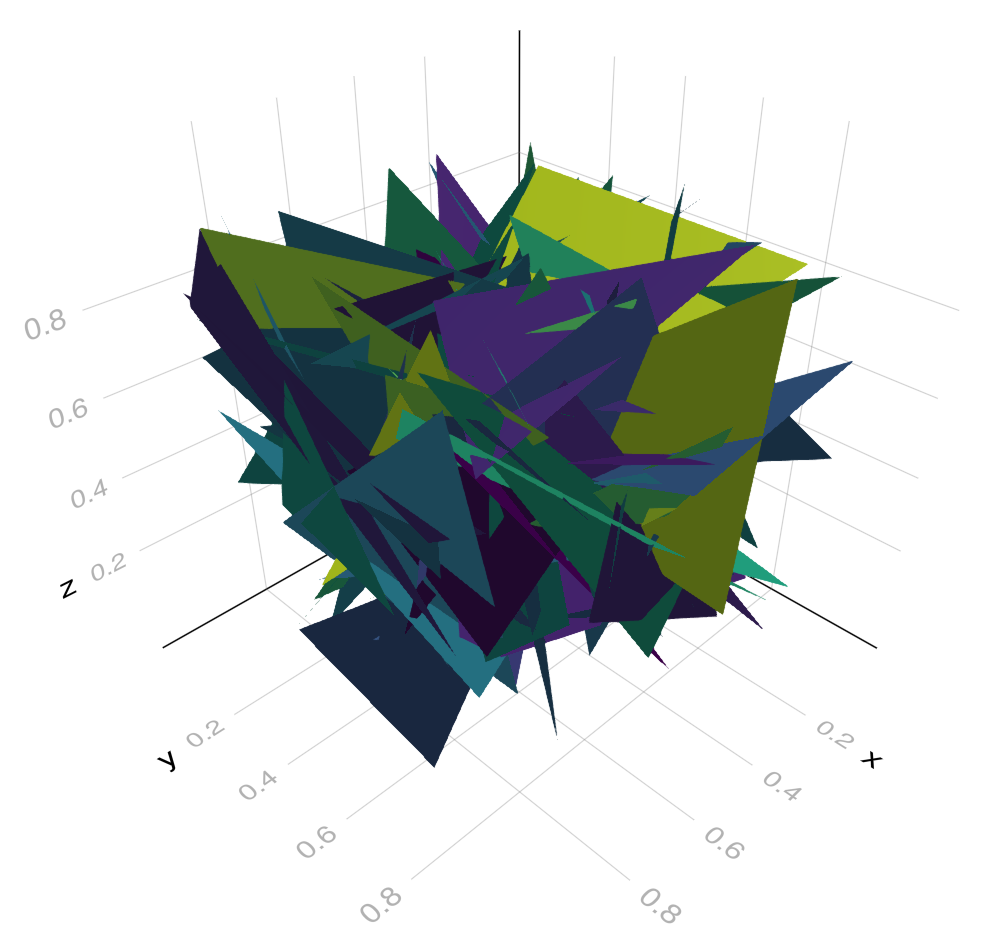
triangles = rand(Triangle, 100)
viz(triangles, color = rand(100))
You can learn more by reading the Meshes.jl documentation. The vector of random colors is converted into actual Colors.jl using the Colorfy.jl package that we also maintain.
I would omit the Ngon argument. Also notice that you can pass a vector of colors with length equal to the number of vertices to get a smooth visualization. Usually, finite element solutions provide the results at the vertices themselves.
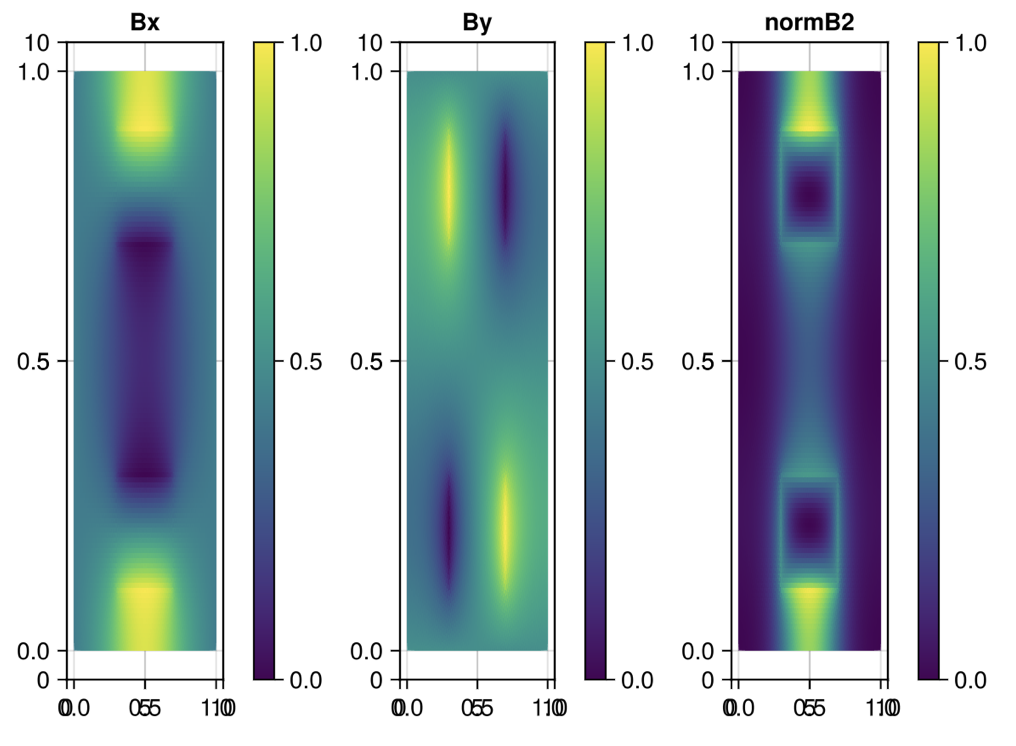
Agree that finite element solutions typically provide nodal values. Here, however, we plot the gradient of the finite element solution that we assume to be constant on each element. We therefore find it more convenient to plot per-element (as opposed to per-node) values.
Question: does the function viz() provide a colorbar option?
I hope to provide more transparent explanation soon.
You can create colorbars as usual with Makie.jl. We also provide a custom cbar function that takes care of the color assignments the same way viz does:
I have just updated that chapter in the book to demonstrate the usage of the colorrange option. It might be useful if you are visualizing multiple fields with potentially different ranges of values.
Also, consider setting the aspect of the axes to Mke.DataAspect() as explained in the chapter. It is always a good idea to preserve the real size of the domain.