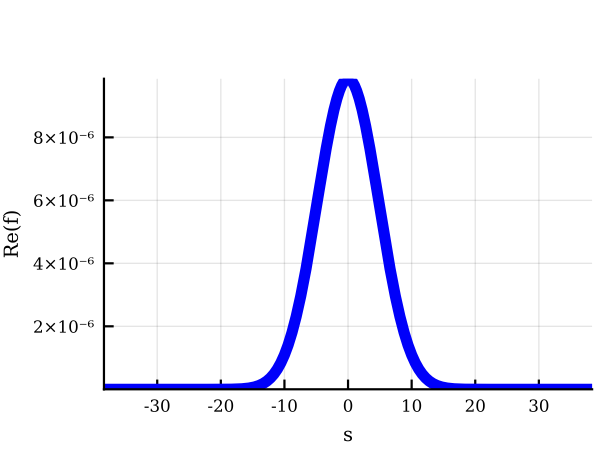
Many of my plots are cut off at the top. For example:
pyplot()
plot(xlabel=“s”,ylabel=“Re(f)”)
plot!(T.s1,T.f1,color=:blue)
plot!(T.s2,T.f2,color=:blue)
Please provide a minimum working example including all data and code, and quote your code using backticks.
Dear David,
Here is a minimal example with figure:
y=[1, 9, 9, 1]
plot!(y)
savefig(“y.pdf”)
The error seems to occur when the maximum is a line rather than a single point.
Jacques

You could do
ylims!(9.5)
I agree that there seem to be some issues when points fall at the plot limit.
Obviously, setting the limits by hand is what I am doing, but I was rather looking for the reason of this problem and for an actual solution to it.
The problem is only happening when using pyplot() as a backend to Plots, it is not happening when using PyPlot directly. I don’t know if it also happens with other backend to Plots.
See also https://github.com/JuliaPlots/Plots.jl/issues/1366.
@mkborregaard’s suggestion of widening the axes for all series types would probably fix the issue described here.