Thanks a lot for the compassion  .
.
One more thing that I probably didn’t clarify enough is our use case.
We measure data and want to extract from it the parameters (i.e. frequency)
but we know very very little about the parameters themselves in advance and we want
that all this happens unsupervised (automatically)
(like the frequency should be between 100e3 and 100e6, or the amplitude between 1 and 1e6).
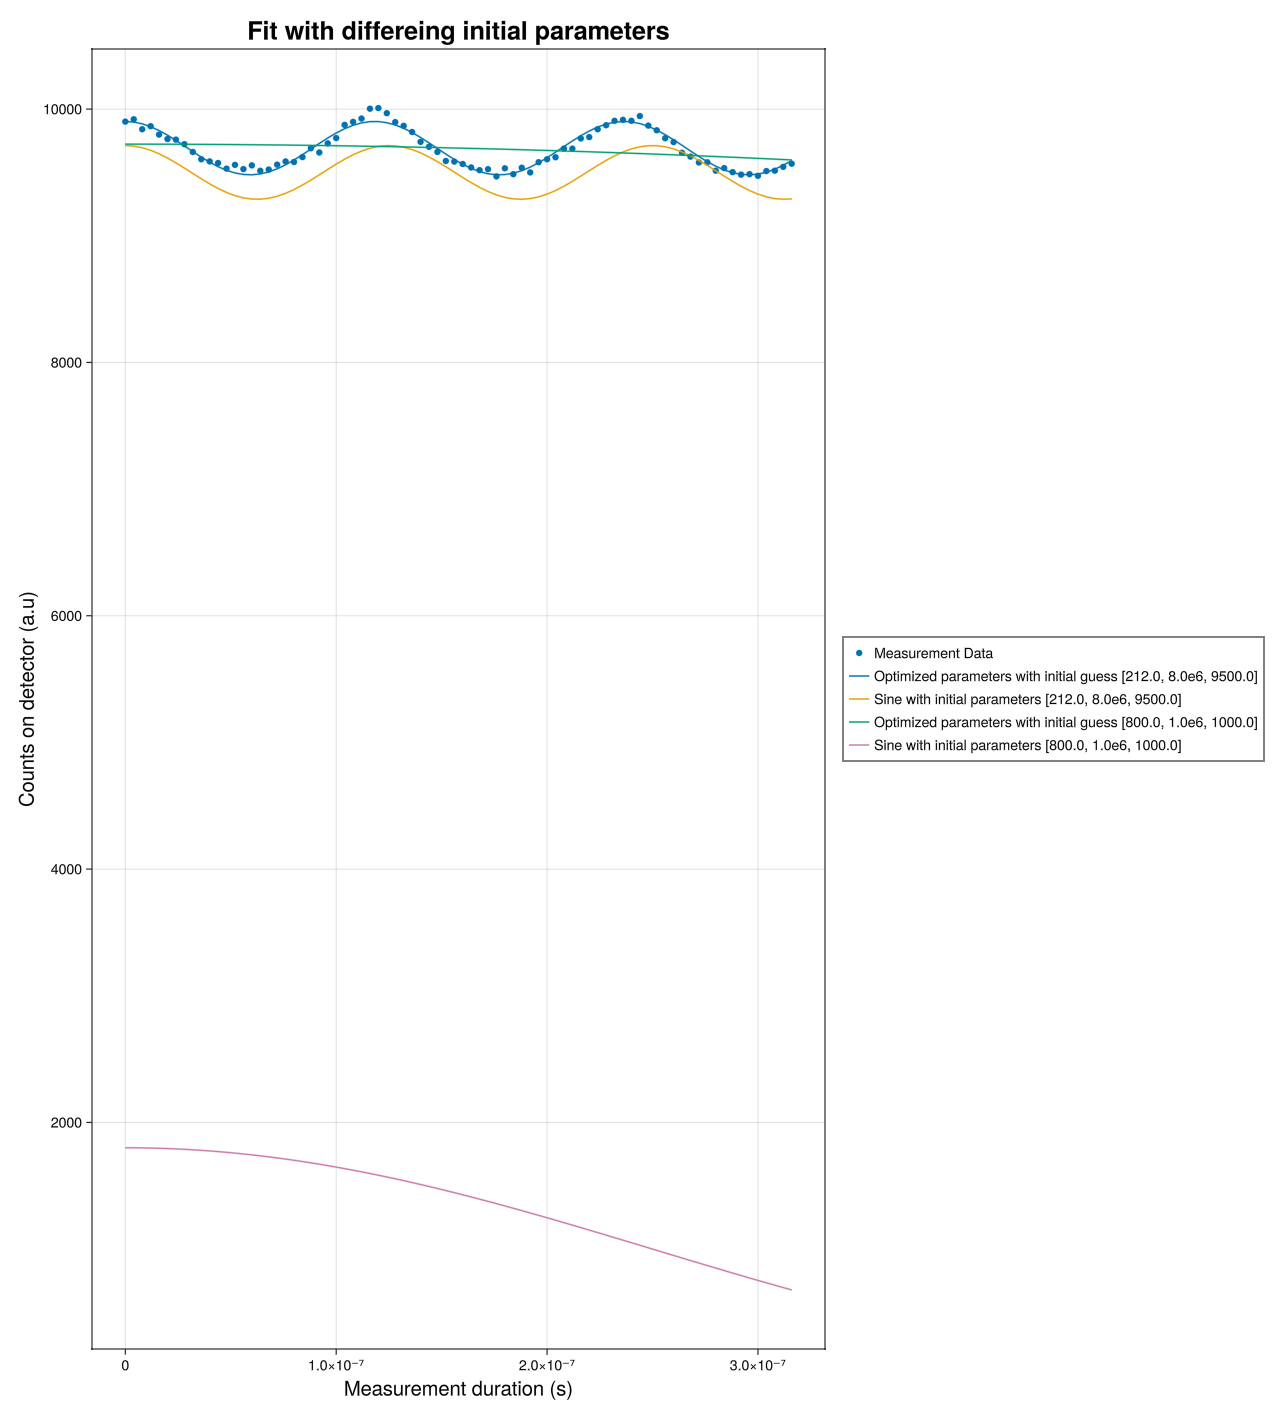
I put together a small example:
using DataFrames
using CSV
using LsqFit
using GLMakie

data = CSV.read("src/Data/estimation_mwe.csv", DataFrame)
axis = data[!, "axis"]
counts = data[!, "counts"]

function amp_cos_offset(t, p)
    p[1] * cos.(2 * π * p[2] * t) .+ p[3]
end

init_params1 = [212.0, 8.0e6, 9500.0]
init_params2 = [800.0, 1.0e6, 1000.0]

fit_res1 = curve_fit(amp_cos_offset, axis, counts, init_params1)
fit_res2 = curve_fit(amp_cos_offset, axis, counts, init_params2)

init_y1 = amp_cos_offset(axis, init_params1)
fit_y1 = amp_cos_offset(axis, fit_res1.param)
init_y2 = amp_cos_offset(axis, init_params2)
fit_y2 = amp_cos_offset(axis, fit_res2.param)
# visualize the fit results
f = Figure()
Axis(f[1, 1],
     title="Fit with differeing initial parameters",
     xlabel="Measurement duration (s)",
     ylabel="Counts on detector (a.u)",
     titlesize=25,
     xlabelsize=20,
     ylabelsize=20
     )

rd = scatter!(axis, counts);
l1 = lines!(axis, fit_y1);
l2 = lines!(axis, init_y1);
l3 = lines!(axis, fit_y2);
l4 = lines!(axis, init_y2);
Legend(f[1, 2], [rd, l1, l2, l3, l4],
    ["Measurement Data", "Optimized parameters with initial guess $init_params1",
        "Sine with initial parameters $init_params1", "Optimized parameters with initial guess $init_params2",
        "Sine with initial parameters $init_params2"])
f
I am not sure how to supply the raw data.
Also
this could be very interesting! If it helps I can also link the python code, that we use
to find the initial parameters (to start the optimization process).