Hi Seth,
Thanks so much for taking the time to help me out with this - I really appreciate it! 

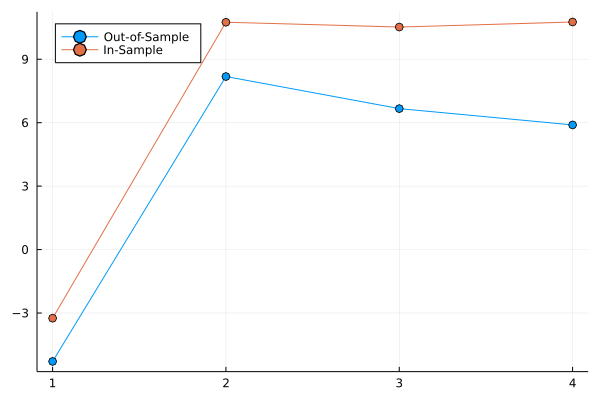
I have a remaining doubt though regarding the values in the result. Since we are estimating model error, I would expect smaller values to be better, but the output of the following example is the opposite of what I would expect:
using DataFrames
using MLBase
using ParetoSmooth
using StatsBase
using StatsPlots
using Turing

X = rand(1.0:100.0, 30)
# True data-generating model is second-order polynomial!
Y = @. 3.0 + 2.0 * X + 0.05 * X^2 + rand(Normal(0, 40))
Xₜ = StatsBase.standardize(ZScoreTransform, X)
Yₜ = StatsBase.standardize(ZScoreTransform, Y)

@model function test(X, Y, o) # 'o' is for 'order'
    σ ~ Exponential(1)
    α ~ Normal(0, 1)
    β ~ MvNormal(o, 1)
    μ = α .+ sum(β .* [X.^i for i in 1:o])
    Y ~ MvNormal(μ, σ)
end

# PSIS_LOO
score1 = psis_loo(test(Xₜ, Yₜ, 1), sample(test(Xₜ, Yₜ, 1), NUTS(), 1_000))
score2 = psis_loo(test(Xₜ, Yₜ, 2), sample(test(Xₜ, Yₜ, 2), NUTS(), 1_000))
score3 = psis_loo(test(Xₜ, Yₜ, 3), sample(test(Xₜ, Yₜ, 3), NUTS(), 1_000))
score4 = psis_loo(test(Xₜ, Yₜ, 4), sample(test(Xₜ, Yₜ, 4), NUTS(), 1_000))

plot(
    1:4,
    # get the :cv_elpd and :naive_lpd values for each model
    [[eval(Symbol("score$i")).estimates[1,1] for i in 1:4] [eval(Symbol("score$i")).estimates[2,1] for i in 1:4]],
    labels=["Out-of-Sample" "In-Sample"],
    legend=:topleft,
    marker=:o
)
Output:

If I roll my own LOOCV function and then plot, it looks like this (result is what I expect for this example):
data = DataFrame(X=Xₜ,Y=Yₜ)

# leave one out cross validation
function loocv(o)
    N = size(data, 1)
    SE = []
    for s in LOOCV(N)
        chain = DataFrame(sample(test(data.X[s], data.Y[s], o), NUTS(), 1_000))
        x = data.X[setdiff(1:N, s)][1]
        y = data.Y[setdiff(1:N, s)][1]
        ŷ = mean([row.α + sum([row[Symbol("β[$i]")] * x^i for i in 1:o]) for row in eachrow(chain)])
        push!(SE, (ŷ - y)^2)
    end
    return sum(SE)
end

order = 4
err = [loocv(o) for o in 1:order]
plot(1:order, err, legend=false, marker=:o)
Output:

Finally, if I multiply the results from PsisLoo by negative 1, I get something that looks like what I would expect:
plot(
    1:4,
    [(-1 .* [eval(Symbol("score$i")).estimates[1,1] for i in 1:4]) (-1 .* [eval(Symbol("score$i")).estimates[2,1] for i in 1:4])],
    labels=["Out-of-Sample" "In-Sample"],
    legend=:topleft,
    marker=:o
)
Output:

So, this was just a really long way to ask if (relative to other models) bigger values in :cv_elpd and :naive_lpd are better 


