Hi all,
I was trying to plot a Slope Field with only 1 solution line like this:

CairoMakie can do better,
I have come out with this
but I have problem that in this code I cannot delete the contour!(...) and it is problematic since the differential equation is
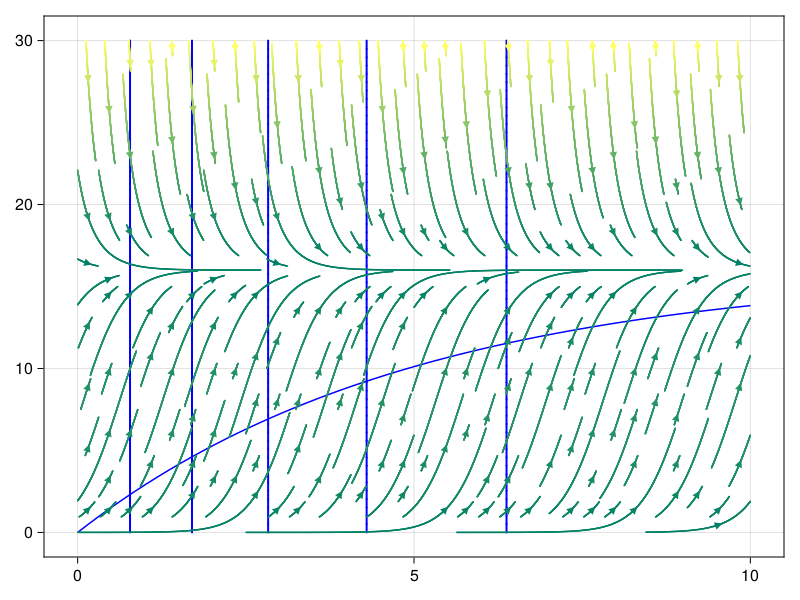
y' = 0.2y(16-y)
And I also have a bit of problem to draw the contour lines correctly with CairoMakie. It should not be vertical lines.
I try either:
f(x,y) = y/exp(-x*(0.2y - 3.2))
or
f(x,y) = 16 - 13*exp(-0.2x)
all were wrong
I have found that the particular solution for initial value problem y(0)=3 is this equation:
16 - 13*exp(-0.2x)
this is my recent code (but it can’t work anymore if I uncomment the lines!(...)):
using CairoMakie

fig = Figure()
ax = Axis(fig[1,1])

X = range(0, stop=10, length=60)
Y = range(0, stop=30, length=60)
# y' = 0.2y(16-y)
# Draw the particular solution that satisfies the initial condition y(0)=3
# write the f(t,y) / f(x,y) here
f(x,y) = 16 - 13*exp(-0.2x)
# f(x,y) = y/exp(-x*(0.2y - 3.2))
contour!(X, Y, f, color = :blue, linewidth=2)
#lines!(X, f, color = :blue, label = "y(0)=3")

dydx(x,y) = Point2f(1, 0.2*y*(16-y) )

streamplot!(dydx, 0..10.0, 0..30.0, colormap=:summer) # colormap = :magma

fig

save("/home/browni/LasthrimProjection/JupyterLab/CairoMakie/directionfield3.png",fig)
Hopefully I can get help here. Thanks