Hi all,
I have tried this code here:
https://gist.github.com/XerxesZorgon/5205facbb7c7ef02999e27ead70a5d59
But I can’t plot it, I am using Jupyter Notebook and Julia REPL it only shows : plotJulia
Hi all,
I have tried this code here:
https://gist.github.com/XerxesZorgon/5205facbb7c7ef02999e27ead70a5d59
But I can’t plot it, I am using Jupyter Notebook and Julia REPL it only shows : plotJulia
Wow, so that’s how to plot.
I am just learning Plots and GLMakie, I have no idea till now… it is not forget, but do not know how…
Define your function as follows
function plotJulia(c::Complex{T};
       xRng = [-1.5,1.5], yRng = [-1.5, 1.5], maxIters=100) where T<:Real
  ...
  #maxIters =1000  #comment out this line
  ...
  #display(heatmap(iterCounts')) #comment out this line, too
end
and call it as:
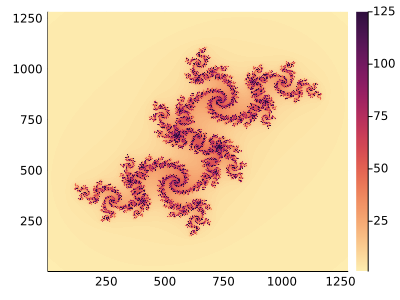
itc= plotJulia( -0.04 - 0.6841im; maxIters=125)
heatmap(itc',  c = :matter, size=(400, 300))
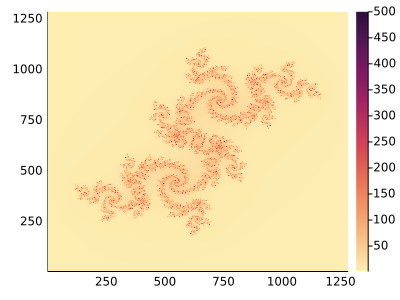
and then replace maxIters=125, by maxIters=500 and look at colorbars of the two heatmaps. You can deduce that the fractal set corresponds to points that leave the disk of radius 2 in about 100-120 iterations. Hence the number
of iterations must be reduced, because
with 1000 iterations the interval [100, 120] is mapped on lighter colors within the range [1, 1000], and the fractal is poorly visible.
125 iterations:
500 iterations:
That’s amazingly beautiful.
Can we make a video of fractals or zoom in of the fractals?
See a beautiful example here and code here by @federicostra.

