Sorry for the confusing title, I’m not really sure how to summarize it. Basically, I have a list of 3D points which are order according the time these points were taken. In a sense, you can think of these as 4D points, where one of the coordinates is time. It looks something like this:
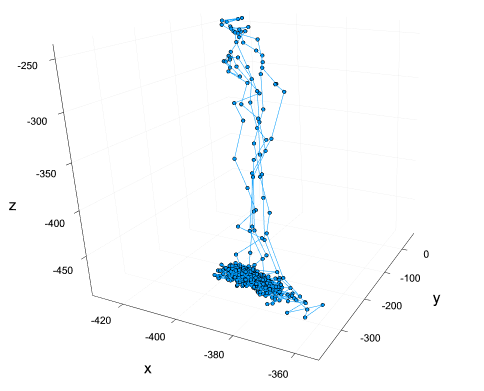
I would like for the time coordinate to be inferred using a gradient color of each point. I’m using Plots.jl and the only way I’ve found to do this is by passing a vector to the attribute marker_z. The problem is that I have 600 points, thus the vector passed to marker_z is of length 600: this completely breaks the plotlyjs() backend I’m using (which is useful because it lets me interact and rotate the 3D plot): the plot doesn’t load at all. It works for a handful of points, but in my case it is not viable.
Is there a solution to this problem? Some other package or backend that lets me interact with the plot and have the points color respect the time series?