How to make this plot in Julia?

How do I make something similar to the following plot in Julia?

using RCall, DataFrames, Random
Random.seed!(123)
d = DataFrame(name = repeat(["A","B","C","D","E","F"], inner=4), 
      time=repeat([0,1,3,6], outer=6), value = rand(24));
@rput d
R"""
library(ggplot2)
library(ggrepel)
ggplot(d, aes(x=time,y=value, color=name)) + geom_point() + geom_line() + 
geom_text_repel(aes(label=name)) + ggtitle("Time evolution")
"""

The features I struggle to reproduce in Plots.jl are:

  • Grouping points in a scatter plot (by name) and connecting them by a line
  • Positioning the labels close to the points without overlapping

Even without ggrepel I can get the following in ggplot2, which is ok:

R"""
library(ggplot2)
ggplot(d, aes(x=time,y=value, color=name)) + geom_point() + geom_line() + 
geom_text(aes(label=name), nudge_y=.03) + ggtitle("No repel")
"""

1 Like

Take a look at the documentation of

https://github.com/JuliaPlots/AlgebraOfGraphics.jl

or

https://github.com/GiovineItalia/Gadfly.jl

The latter should be very familiar if you are coming from R.

3 Likes

Thanks @juliohm I was under the impression that Gadfly was stalled, but that appears to be a misunderstanding.

It actually does ok:

Gadfly

billede

With proper name-spacing and extra packages it also works from Weave:

using Gadfly, Cairo, Fontconfig
plot(d, x=:time, y=:value, color=:name, label=:name, 
  Gadfly.Geom.point(), Gadfly.Geom.line(), Gadfly.Geom.label())

Thanks for making me re-visit that.

AlgebraOfGraphics

I’m not able to find a way to add text-labels on the plot in AlgebraOfGraphics.

This is as close as I can get:

using AlgebraOfGraphics, GLMakie
plt = data(d) * (visual(Scatter) + visual(Lines) ) * 
      mapping(:time, :value, color = :name);
AlgebraOfGraphics.draw(plt)

Also, I’m not able to get the AOG plot to work from Weave.

VegaLite

In VegaLite, I can plot points or lines or text-labels, but I can not figure out how to combine them:

using VegaLite
d |> @vlplot(:line, x = :time, y= :value, color = :name)

billede

1 Like

It is possible with Plots.jl’s StatsPlots, but it should be easier:

using DataFrames, Random, StatsPlots
theme(:ggplot2)
default(dpi=600)

Random.seed!(123)
df = DataFrame(name = repeat(["A","B","C","D","E","F"], inner=4), 
      time=repeat([0,1,3,6], outer=6), value = rand(24))
#
dx, dy = extrema.((df.time, df.value))
dx, dy = 0.025 .* (dx[2] - dx[1], dy[2] - dy[1])
nam0 = first.(keys(groupby(df, :name)))
cdic = Dict(nam0 .=> palette(:default)[1:length(nam0)])
col0 = [cdic[x] for x in df.name]

@df df plot(:time, :value, marker=:circle, ms=3, group=:name, legend=:outertopright, legendtitle="name")
for (x,y,nm,c) in zip(df.time, df.value, df.name, col0)
    annotate!(x + rand((-dx,dx)), y + rand((-dy,dy)), (nm, 7, c))
end
Plots.current()

3 Likes

There’s definitely a way to do this in both VegaLite and AoG (including the text), though I don’t think either make it easy to do the randomized dodge you want (you’d have to define a new column that has random offsets).

In AoG you can use the Text plot type (example here) and combine it with the above figure using the + operator. Note that any Makie plot types documented here each have a corresponding CamelCase name that can be passed to visual.

In vega lite I think you would need to use an empty @vlplot() first, e.g. @vlplot() + @vlplot(line fields) + @vlplot(text-label filed), but it’s been a little while since I used it.

That said, if Gadfly meets your needs, maybe you don’t need to look further. There are definitely trade-offs between them.

1 Like

Thanks a lot @rafael.guerra ! That is impressively close to he ggplot version.

I had given up on StatsPlots because of the large compilation times, but that has really improved tremendously now, so I’ll definitely revisit that.

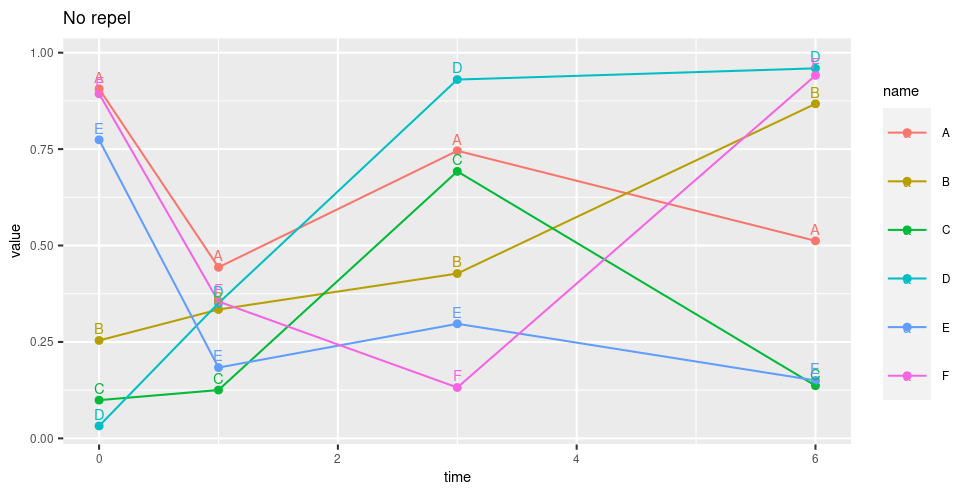
It would be great to have a simple way to do label colouring, and the non-overlapping label-placement as {ggrepel}, but I’ll probably come back to your solution for inspiration next time I need this.

It’s great that we have so many options in the Julia plotting eco-system, but it is a challenge to keep updated. Any thoughts on which (if any) is going to be the “ggplot for Julia”?

3 Likes

Here is another example using StatsPlots and series_annotations.

using DataFrames
using CSV
## using Plots
using StatsPlots
using LaTeXStrings
Plots.default(size=(600,300))
Plots.pyplot()
## Plots.GRBackend()
date_min = 1995
date_max = 2055
##
## UL 90% CL B(tau -> mu gamma)
##
## 2e-9      0    0     "SuperB 75ab-1"  2025 guest
##

data = """
val       uncp uncm  event             year type
4.4e-8    0    0     "BaBar 2010"      2010 pub
4.5e-8    0    0     "Belle 2008"      2008 pub
1e-9      0    0     "BelleII"         2025 est
5e-9      0    0     "SCT/STCF"        2030 guest
1e-9      0    0     "CEPC (Z)"        2035 guest
2e-9      0    0     "FCC-ee (Z)"      2040 est
"""

df = DataFrame(CSV.File(IOBuffer(data), delim=' ', ignorerepeated=true))
df = dropmissing(df, disallowmissing=true)

type_to_color = Dict("pub" => :green, "est" => :red, "guest" => :orange)
df.color = [type_to_color[type] for type in df.type]
@df df Plots.plot(
  :year,
  :val,
  series_annotations = text.(:event, :left, :bottom, rotation=45, 9),
  title=L"${\cal B}(\tau\rightarrow \mu\gamma)$",
  ## xlabel="year",
  ylabel="90% CL UL",
  xlims=(date_min, date_max),
  ylims=(2e-10, 1e-6),
  xrotation=30,
  color = :color,
  msw = 0,
  legend = false,
  seriestype=:scatter,
  yscale=:log10,
  markersize = 7,
  framestyle = (:box, :grid)
)

test-julia-plot-labels_4_0

3 Likes

Thanks @haberdashPI . I need a bit more help.

With VegaLite I can get the lines and points, but not the text labels. This is what I try:

using VegaLite
d |> @vlplot()  + @vlplot(:line, x = :time, y= :value, color = :name) + @vlplot(:point, x = :time, y= :value, color = :name)  + @vlplot(:text, x = :time, y= :value, color = :name) 

In AOG, this gives me an error:

using AlgebraOfGraphics, GLMakie
plt = data(d) * (visual(Scatter) + visual(Lines) + visual(Annotations)) * mapping(:time, :value, color = :name, label= :name);
AlgebraOfGraphics.draw(plt)

Here’s the solution for AoG

let
	scatterlines = (visual(Scatter) + visual(Lines)) * mapping(:time, :value, color = :name)
	annotations  = visual(Annotations) * mapping( :name => verbatim, position=(:time, :value) => Point, color = :name)

	plt = data(d) * (scatterlines + annotations)
		
	draw(plt)
end

It’s a bit hidden in the docs: http://juliaplots.org/AlgebraOfGraphics.jl/stable/gallery/gallery/scales/prescaled_data/#Pre-scaled-data

This PR add multiargument method to annotations by piever · Pull Request #1193 · MakieOrg/Makie.jl · GitHub will allow the code to be more like what you attempted.

5 Likes

For vegalite you haven’t said what to set the string of text to: I think you need @vlplot(:text, x = :time, y = :value, color = :name, text = :name)

Thanks @haberdashPI . This does show the lables, but right on top of the points.

Removing the points helps a bit:

using VegaLite
d |> @vlplot()  + @vlplot(:line, x = :time, y= :value, color = :name) + @vlplot(:text, x = :time, y = :value, color = :name, text = :name)

billede

1 Like

You can use the position offset channels to do this, I believe.

Here’s one with AlgebraOfGraphics and random label offsets:

Random.seed!(123)
d = DataFrame(name=repeat(["A","B","C","D","E","F"], inner=4), 
              time=repeat([0,1,3,6], outer=6),
              value=rand(24));

# Computed columns
d.point = Point.(d.time, d.value)
@. d.offset = map(x->15x,sincos(2Ď€*rand())) # Too clever but interesting?

# Layers
scatter_lines = (visual(Scatter) + visual(Lines)) *
                mapping(:time, :value)
                
labels = visual(Text, align=(:center, :center)) *
         mapping(:name => verbatim,
                 position=:point,
                 offset=:offset => verbatim)

draw(data(d) * mapping(color=:name) * (scatter_lines + labels);
     axis=(width=400, height=300))

image

Remarks

  • It would be nice to see Makie #1193 finalized so we don’t need to map x and y twice in different ways
  • I guess that would also fix the lost x label
  • It feels a bit random when verbatim is required and when not (why for text values and offset but not position?)
  • We can use visual(ScatterLines) instead of Scatter + Lines but I’d wait until AoG is updated to Makie 0.16 (it fixes a color issue)
  • To use this in Weave use CairoMakie instead of GLMakie
4 Likes

Thanks a lot @sijo and @fabgrei . It looks like AoG could become the “ggplot for Julia”. It would indeed be great with a more unified syntax. I’m still not quite sure how to parse the mapping for the Text / Annotations visual. Are they actually the same (Text and Annotations)?

1 Like

According to the discussion in Makie #1193 Annotations is now a wrapper for Text and will be deprecated.

To understand the mapping: every visual has a corresponding Makie method with documented arguments. The Text visual corresponds to the text method.

In the current Makie version, text takes:

  • a single positional argument for the text (as string)
  • an optional position keyword argument for the position (as Point)
  • an optional offset keyword argument (as (x,y) tuple)
  • …

(in each case we can give text a vector instead of a single value.)

This is directly reflected in our mapping call:

mapping(:name => verbatim,
        position=:point,
        offset=:offset => verbatim)
  • We give :name as positional argument (that’s the column holding the strings). The => verbatim transformation is added so the value is used “as is”.
  • The position keyword is used to specify the column holding the points. I used a column with pre-computed points, while @fabgrei computed the point with a transformation that takes two values as input: position=(:time, :value) => Point (because the Point method takes two values to make a point).
  • The offset keyword is used to specify the column holding precomputed offsets. Here it seems we need verbatim again.

The verbatim thing is bit annoying… I don’t know the rule for when it’s required, so I just try to add one if it doesn’t work without. Maybe @piever can explain why and when it’s required…

3 Likes

So, annotations with AlgebraOfGraphics are somewhat annoying for the two reasons described above:

  • The signature is non-standard (rather than just text(x, y, labels=labels), which would be more in line with scatter)
  • One of the arguments is a vector of strings, which triggers the need for verbatim.

The first problem should be more straightforward to solve (see this PR).

The second one is trickier. The main issue is that AlgebraOfGraphics treats any vector it does not recognize as “numeric” (mostly AbstractVector{<:Number}) or “geometric” (lists of points, or polygons, etc…) as a “categorical vector”, which in turns triggers a conversion from categorical values to integers (as well as grouping of the data).

verbatim is a way to escape that, because, in the case of annotations or text, the categorical vector (vector of strings) is what we want to pass to the plot directly, as Makie can handle that. There is an issue open to track this, but I’m not yet 100% sure what the best solution is.

One possible way forward (once labels in annotations or text are passed as a keyword argument), could be to only consider a keyword argument categorical if there exists a palette (categorical scale) for it. That does add some complexity (as categorical variables determine how the data is grouped, which is relevant to compute analyses, and would now depend on the choice of scales), but it would avoid the “aggressive conversion pipeline”.

From what I understand, ggplot2 fixes this by “hardcoding” the plot attributes that cause grouping (see here), but I would prefer a more flexible approach. We could still get something like that by default, because those would be variables with built-in palettes.

3 Likes

Thanks a lot @sijo and @piever. This makes it a lot clearer how it works.
I’ll definitely look more into AlgebraOfGraphics.

While ggplot2 is far from perfect, I think they do a good job at setting defaults that give a reasonable result most of the time.

Update: The signature of Text is now standard, so it takes x, y, text = text which means a mapping call could look like mapping(:x, :y, text = :text => verbatim) * visual(Text)

2 Likes

Thanks for following up on this @jules

Is this in an upcoming version, or should it work now?

Doing this:

using AlgebraOfGraphics, GLMakie
using Random, DataFrames
Random.seed!(123)
d = DataFrame(name = repeat(["A","B","C","D","E","F"], inner=4), 
      time=repeat([0,1,3,6], outer=6), value = rand(24));

plt = data(d) * (visual(Scatter) + visual(Lines) + visual(GLMakie.Text)) * mapping(:time, :value, color = :name, text = :name => verbatim) ;

AlgebraOfGraphics.draw(plt)

I get a stacktrace starting with:

Error showing value of type AlgebraOfGraphics.FigureGrid:
ERROR: MethodError: no method matching gl_convert(::Vector{String})
Closest candidates are:
  gl_convert(::T) where T<:ColorTypes.Colorant at ~/.julia/packages/GLMakie/K6iJk/src/GLAbstraction/GLUniforms.jl:194
  gl_convert(::Quaternion) at ~/.julia/packages/GLMakie/K6iJk/src/glshaders/particles.jl:30
  gl_convert(::StaticArraysCore.SMatrix{N, M, T}) where {N, M, T} at ~/.julia/packages/GLMakie/K6iJk/src/GLAbstraction/GLUniforms.jl:230

Also, if I write
visual(Text))
I get this error:

WARNING: both GLMakie and Base export "Text"; uses of it in module Main must be qualified
ERROR: UndefVarError: Text not defined

Am I doing it wrong?

Use Makie.Text to avoid the ambiguity error, Base has its own Text which is a little annoying for us. And I think the problem is that you use your mapping with text = ... on Scatter, Lines and Text at the same time, so it errors for Scatter or Lines probably which pass through the unused attribute until GLMakie chokes.

1 Like