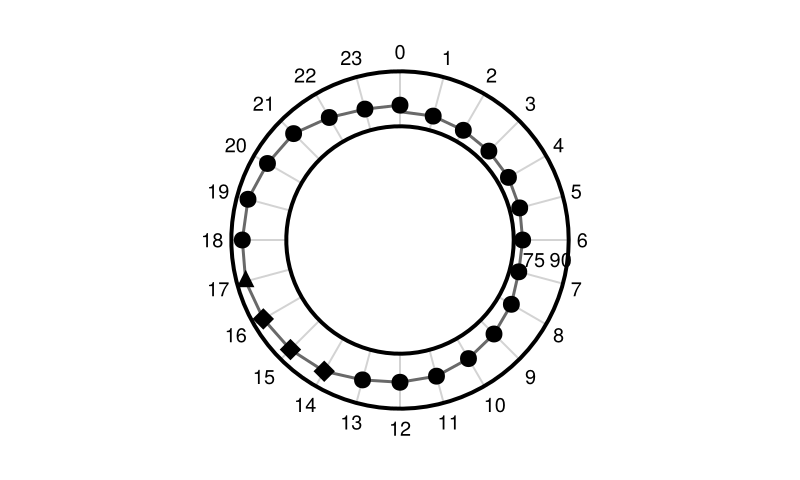
After much experimentation, I did indeed find that your suggestions worked wonders here @JonasWickman !  What I ended up doing is making the rlimits of each PolarAxis break up between 0, 3.33, 6.66, 10 to create reasonably sized bandwidths. Here’s an example of a plot I made; still need to tweak the layout to make it cleaner, but it captures the vision:
For future reference, here is what the code looks like. Folks can adapt it however they see fit:
using CairoMakie
f = Figure(
    size = (240, 240)
);

# Scale data in-between band ranges
function scale_vals(data, r)
    r_min = minimum(data)
    r_max = maximum(data)
    t_min = r[1]
    t_max = r[2]

    [(m - r_min)/(r_max - r_min) * (t_max - t_min) + t_min for m in data]
end

# Outside ring
ax = PolarAxis(
    f[1, 1],
    width = 200,
    height = 240,
    rminorgridvisible = false,
    rminorticksvisible = false,
    rgridvisible = false,
    rticks = LinearTicks(2),
    rticklabelsize = 10,
    rticklabelsvisible = false,
    rgridcolor = :blue,
    rlimits = (6.66, 10),
    thetaminorticksvisible = false,
    thetaticks = (collect(-3pi/2:15 * pi / 180:pi/2)[1:end-1], vcat("0", ["$x" for x in 23:-1:1])),
    thetaticklabelsize = 14,
    thetaminorticks = IntervalsBetween(3),
    thetagridcolor = :black,
    thetagridvisible = false,
    thetagridwidth = 1,
    clip = false
)

scatter!(ax, collect(-3pi/2:15 * pi / 180:pi/2)[1:end-1], scale_vals(reverse(hourly_vars["wind_speed_10m"]), ax.rlimits.val), color = :black, markersize = 12, marker = '↑', rotation = hourly_vars["wind_direction_10m"] .* (pi / 180))

# Middle ring
ax = PolarAxis(
    f[1, 1],
    width=120,
    height=120,
    rminorgridvisible = false,
    rminorticksvisible = false,
    rgridvisible = false,
    rticks = LinearTicks(2),
    rticklabelsize = 10,
    rticklabelsvisible = false,
    rgridcolor = :blue,
    rlimits = (3.33, 6.66),
    thetaminorticksvisible = false,
    thetaticks = (collect(-3pi/2:15 * pi / 180:pi/2)[1:end-1], vcat("0", ["$x" for x in 23:-1:1])),
    thetaticklabelsize = 10,
    thetaticklabelsvisible = false,
    thetaminorticks = IntervalsBetween(3),
    thetagridcolor = :black,
    thetagridvisible = false,
    thetagridwidth = 1,
    clip = false,
)

norm_val = ax.rlimits.val[1] / minimum(hourly_vars["temperature_2m"])

scatter!(ax, collect(-3pi/2:15 * pi / 180:pi/2)[1:end-1], scale_vals(reverse(hourly_vars["temperature_2m"]), ax.rlimits.val), color = :black, markersize = 8, marker = markers)

# Inside ring
ax = PolarAxis(
    f[1,1];
    width=70,
    height=70,
    rlimits = (0, 3.33),
    rminorgridvisible = false,
    rminorticksvisible = false,
    rgridvisible = false,
    rticks = LinearTicks(2),
    rticklabelsize = 10,
    rticklabelsvisible = false,
    rgridcolor = :blue,
    thetaminorticksvisible = false,
    thetaticks = (collect(-3pi/2:15 * pi / 180:pi/2)[1:end-1], vcat("0", ["$x" for x in 23:-1:1])),
    thetaticklabelsvisible = false,
    thetaminorticks = IntervalsBetween(3),
    thetagridcolor = :black,
    thetagridvisible = false,
    thetagridwidth = 1,
    clip = false,
);

p = barplot!(ax, collect(-3pi/2:15 * pi / 180:pi/2)[1:end-1], rand(0:.1:3.33, 24))
pp = popat!(p.plots, findfirst(x -> x isa Poly, p.plots))
polys = map(pp[1].value) do rects
    map(rects) do rect
        N_steps = 100
        mini = minimum(rect); maxi = maximum(rect)
        ps = Point2f[mini, Point2f(mini[1], maxi[2]), maxi, Point2f(maxi[1], mini[2]), mini]
        ps = map(range(0, 4, length = N_steps)) do f
            ps[1] * max(0, 1-f) +
            ps[2] * max(0, 1 - abs(f-1)) +
            ps[3] * max(0, 1 - abs(f-2)) +
            ps[4] * max(0, 1 - abs(f-3)) +
            ps[5] * max(0, 1 - abs(f-4))
        end
        Makie.Polygon(ps)
    end
end
poly!(p, attributes(pp), polys[1], strokecolor = :black, strokewidth = 2, color = :black)