Log 05: August 3rd, 2025 - Seeing the Vision ![]()
AT LAST! I posted another discussion over
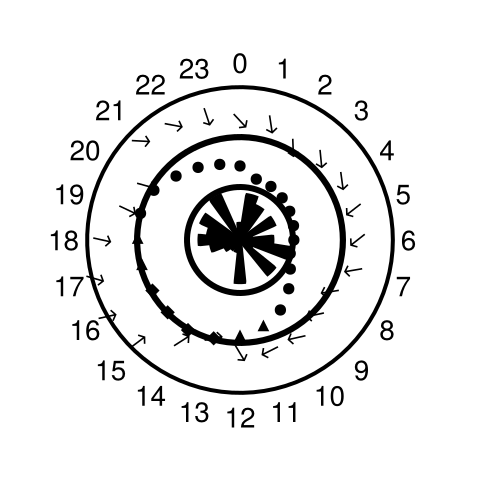
in Discourse about How To Make Concentric Polar Axes with Custom Band Size in Makie? and thanks to some pointers from @jules and tinkering by @JonasWickman, I was able to get the vision of my Polar weather plot working:
Many thanks for the support from folks on the help! Also, I had to update and figure out how to hack out the radial bar plot hack using CairoMakie.jl based on the following post: Wind Rose 'hard' stacked barplot edges in GLMakie - #2 by ffreyer and solution by @ffreyer. To create a figure like this, the code (with updates to the Makie interface) is here:
using CairoMakie
using Luxor

f = Figure(
    size = (240, 240)
);

function scale_vals(data, r)
    r_min = minimum(data)
    r_max = maximum(data)
    t_min = r[1]
    t_max = r[2]

    [(m - r_min)/(r_max - r_min) * (t_max - t_min) + t_min for m in data]
end

# Outside ring
ax = PolarAxis(
    f[1, 1],
    width = 200,
    height = 240,
    rminorgridvisible = false,
    rminorticksvisible = false,
    rgridvisible = false,
    rticks = LinearTicks(2),
    rticklabelsize = 10,
    rticklabelsvisible = false,
    rgridcolor = :blue,
    rlimits = (6.66, 10),
    thetaminorticksvisible = false,
    thetaticks = (collect(-3pi/2:15 * pi / 180:pi/2)[1:end-1], vcat("0", ["$x" for x in 23:-1:1])),
    thetaticklabelsize = 14,
    thetaminorticks = IntervalsBetween(3),
    thetagridcolor = :black,
    thetagridvisible = false,
    thetagridwidth = 1,
    clip = false
)

scatter!(ax, collect(-3pi/2:15 * pi / 180:pi/2)[1:end-1], scale_vals(reverse(hourly_vars["wind_speed_10m"]), ax.rlimits.val), color = :black, markersize = 12, marker = '↑', rotation = hourly_vars["wind_direction_10m"] .* (pi / 180))

# Middle ring
ax = PolarAxis(
    f[1, 1],
    width=120,
    height=120,
    rminorgridvisible = false,
    rminorticksvisible = false,
    rgridvisible = false,
    rticks = LinearTicks(2),
    rticklabelsize = 10,
    rticklabelsvisible = false,
    rgridcolor = :blue,
    rlimits = (3.33, 6.66),
    thetaminorticksvisible = false,
    thetaticks = (collect(-3pi/2:15 * pi / 180:pi/2)[1:end-1], vcat("0", ["$x" for x in 23:-1:1])),
    thetaticklabelsize = 10,
    thetaticklabelsvisible = false,
    thetaminorticks = IntervalsBetween(3),
    thetagridcolor = :black,
    thetagridvisible = false,
    thetagridwidth = 1,
    clip = false,
)

norm_val = ax.rlimits.val[1] / minimum(hourly_vars["temperature_2m"])

scatter!(ax, collect(-3pi/2:15 * pi / 180:pi/2)[1:end-1], scale_vals(reverse(hourly_vars["temperature_2m"]), ax.rlimits.val), color = :black, markersize = 8, marker = markers)

# Inside ring
ax = PolarAxis(
    f[1,1];
    width=70,
    height=70,
    rlimits = (0, 3.33),
    rminorgridvisible = false,
    rminorticksvisible = false,
    rgridvisible = false,
    rticks = LinearTicks(2),
    rticklabelsize = 10,
    rticklabelsvisible = false,
    rgridcolor = :blue,
    thetaminorticksvisible = false,
    thetaticks = (collect(-3pi/2:15 * pi / 180:pi/2)[1:end-1], vcat("0", ["$x" for x in 23:-1:1])),
    thetaticklabelsvisible = false,
    thetaminorticks = IntervalsBetween(3),
    thetagridcolor = :black,
    thetagridvisible = false,
    thetagridwidth = 1,
    clip = false,
);

p = barplot!(ax, collect(-3pi/2:15 * pi / 180:pi/2)[1:end-1], rand(0:.1:3.33, 24))
pp = popat!(p.plots, findfirst(x -> x isa Poly, p.plots))
polys = map(pp[1].value) do rects
    map(rects) do rect
        N_steps = 100
        mini = minimum(rect); maxi = maximum(rect)
        ps = Point2f[mini, Point2f(mini[1], maxi[2]), maxi, Point2f(maxi[1], mini[2]), mini]
        ps = map(range(0, 4, length = N_steps)) do f
            ps[1] * max(0, 1-f) +
            ps[2] * max(0, 1 - abs(f-1)) +
            ps[3] * max(0, 1 - abs(f-2)) +
            ps[4] * max(0, 1 - abs(f-3)) +
            ps[5] * max(0, 1 - abs(f-4))
        end
        Makie.Polygon(ps)
    end
end
poly!(p, attributes(pp), polys[1], strokecolor = :black, strokewidth = 2, color = :black)
Here’s how it looks on my eink display:

With this part out of the way, I think we now dip back more into software engineering. Basically, what I need to figure out is how to best create a layout-ing engine for my eink display that:
- Keeps track of where components are in a display
- Segments out the display into a grid
- Handles components
The biggest question I have is where to put my tinkerings for components. Probably I’ll make a package like JinkiesComponents that has a bunch of extensions to load different components like for weather, todo lists, calendars, etc.
And with that! We are back to hackings!