To keep it brief, I want to plot complex phase (angle) of a complex field. It seemed like Makie.jl’s contour or volume, should do the trick, but I get very noisy results for some reason?
using GLMakie
ph = [(r = hypot(x, y); ϕ = atan(x, y); angle(r*(r .- 5)*exp(1im*(2π*z/10 + ϕ))))
for x in LinRange(-10, 10, 200), y in LinRange(-10, 10, 200), z in LinRange(-10, 10, 200)]
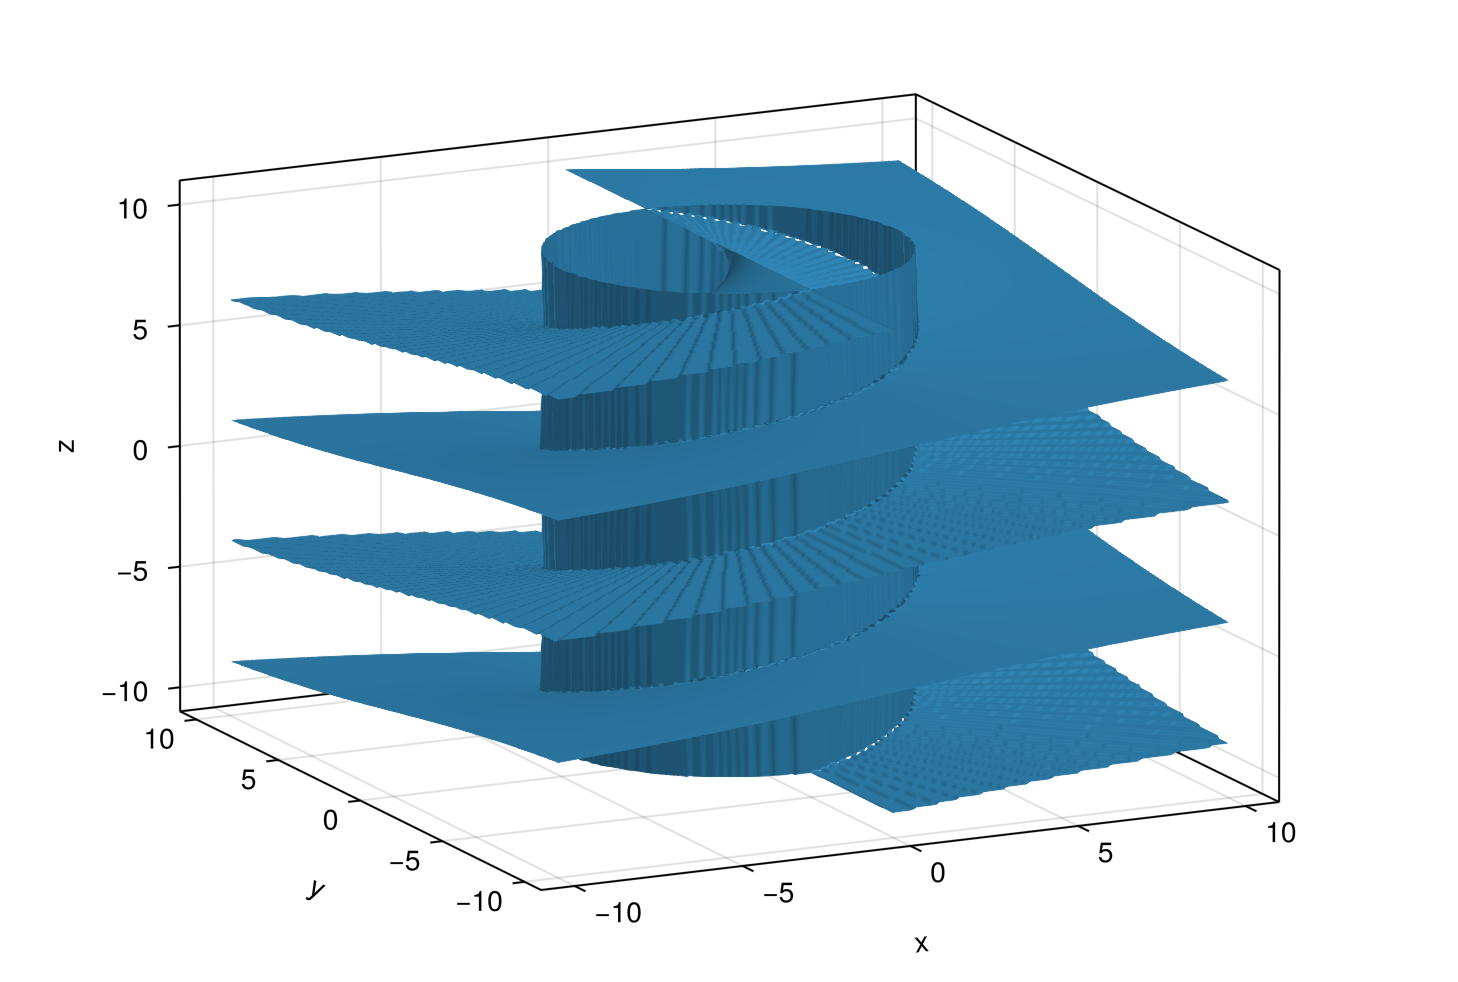
contour(ph)
should yield something like
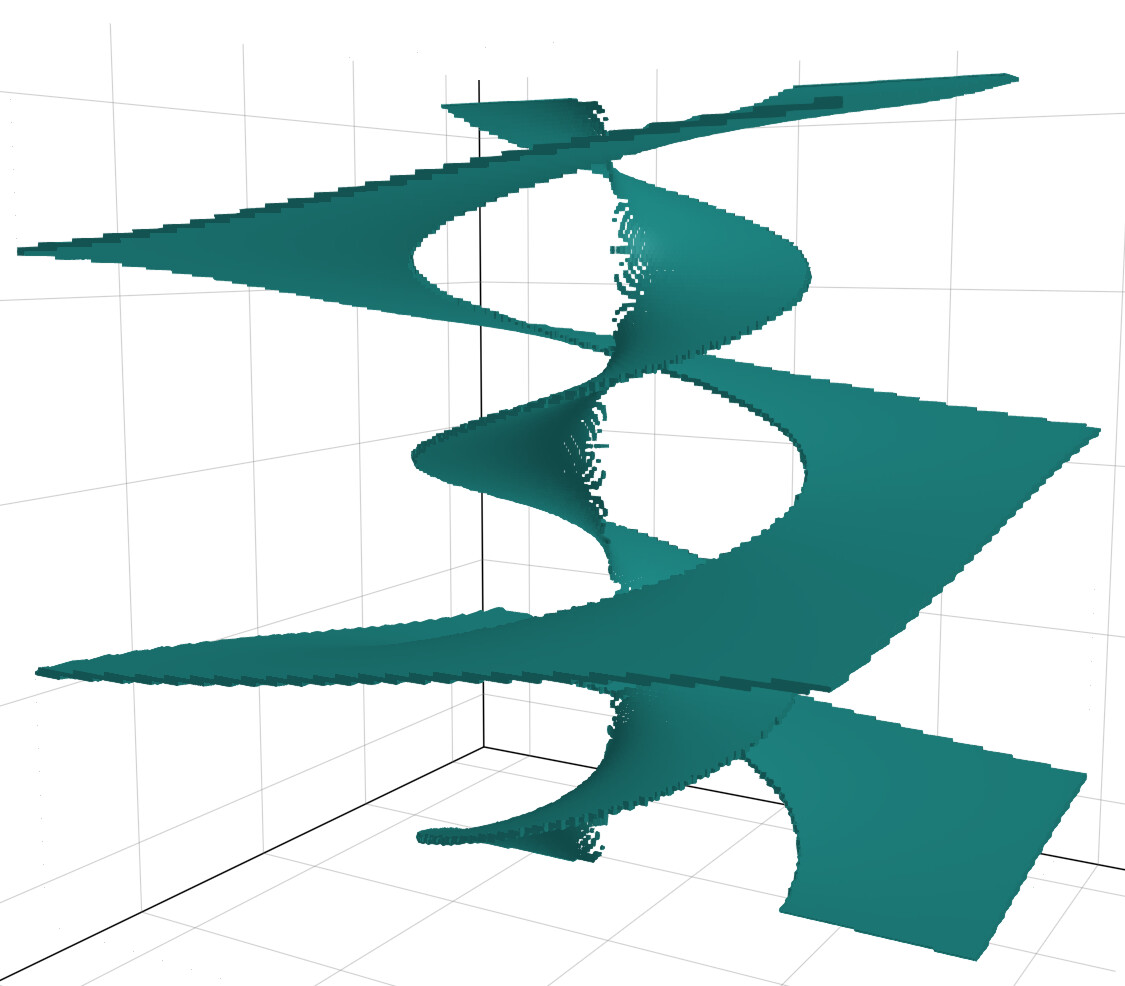
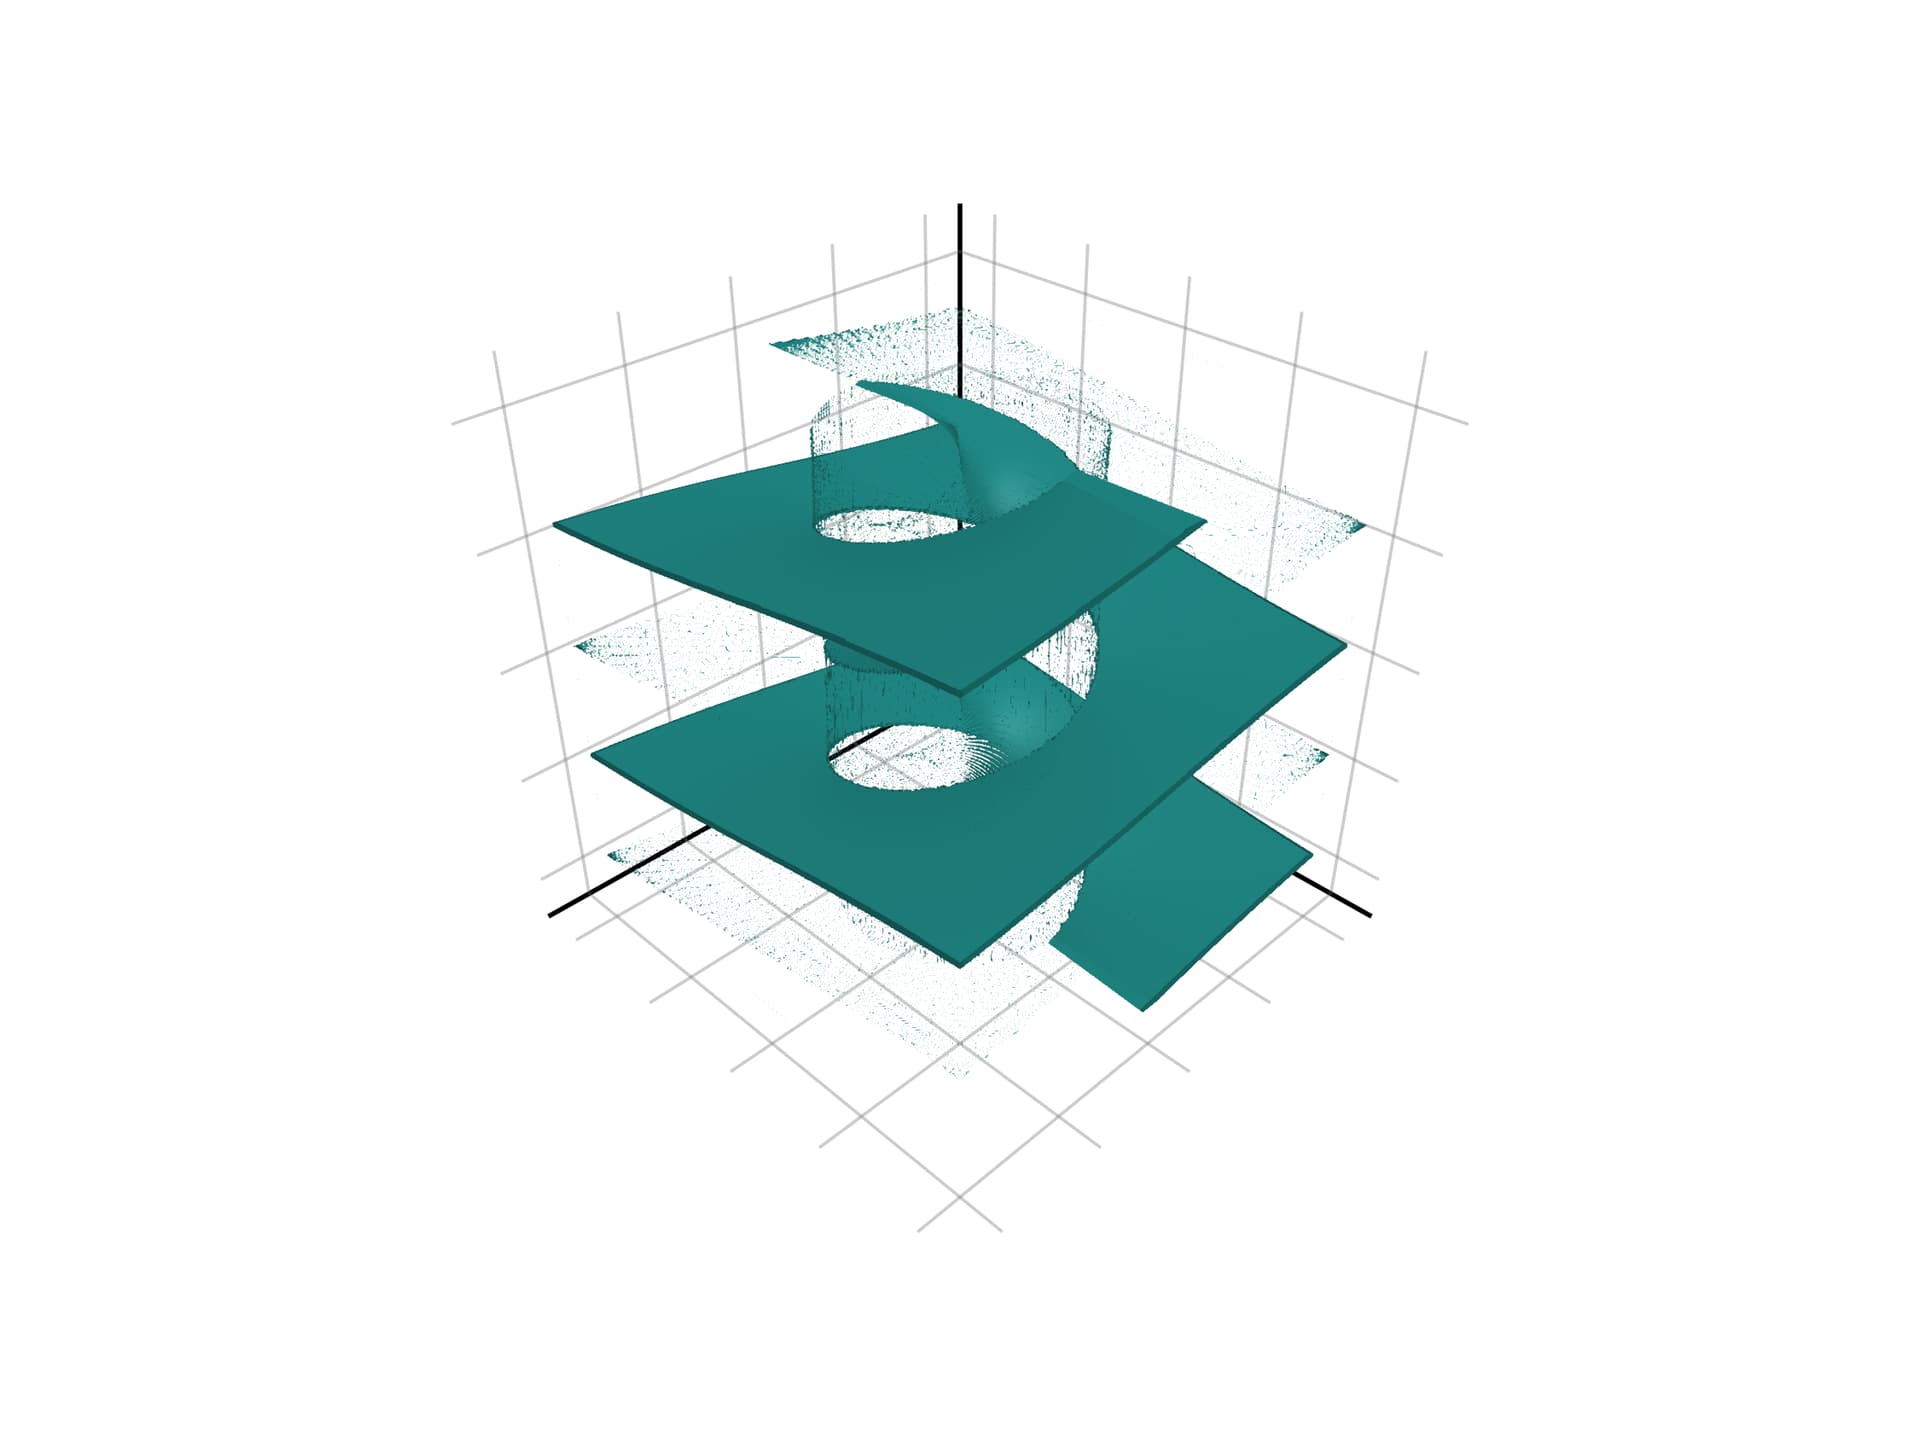
volume(ph, algorithm = :iso, isovalue = 0., isorange = 0.05)
yields
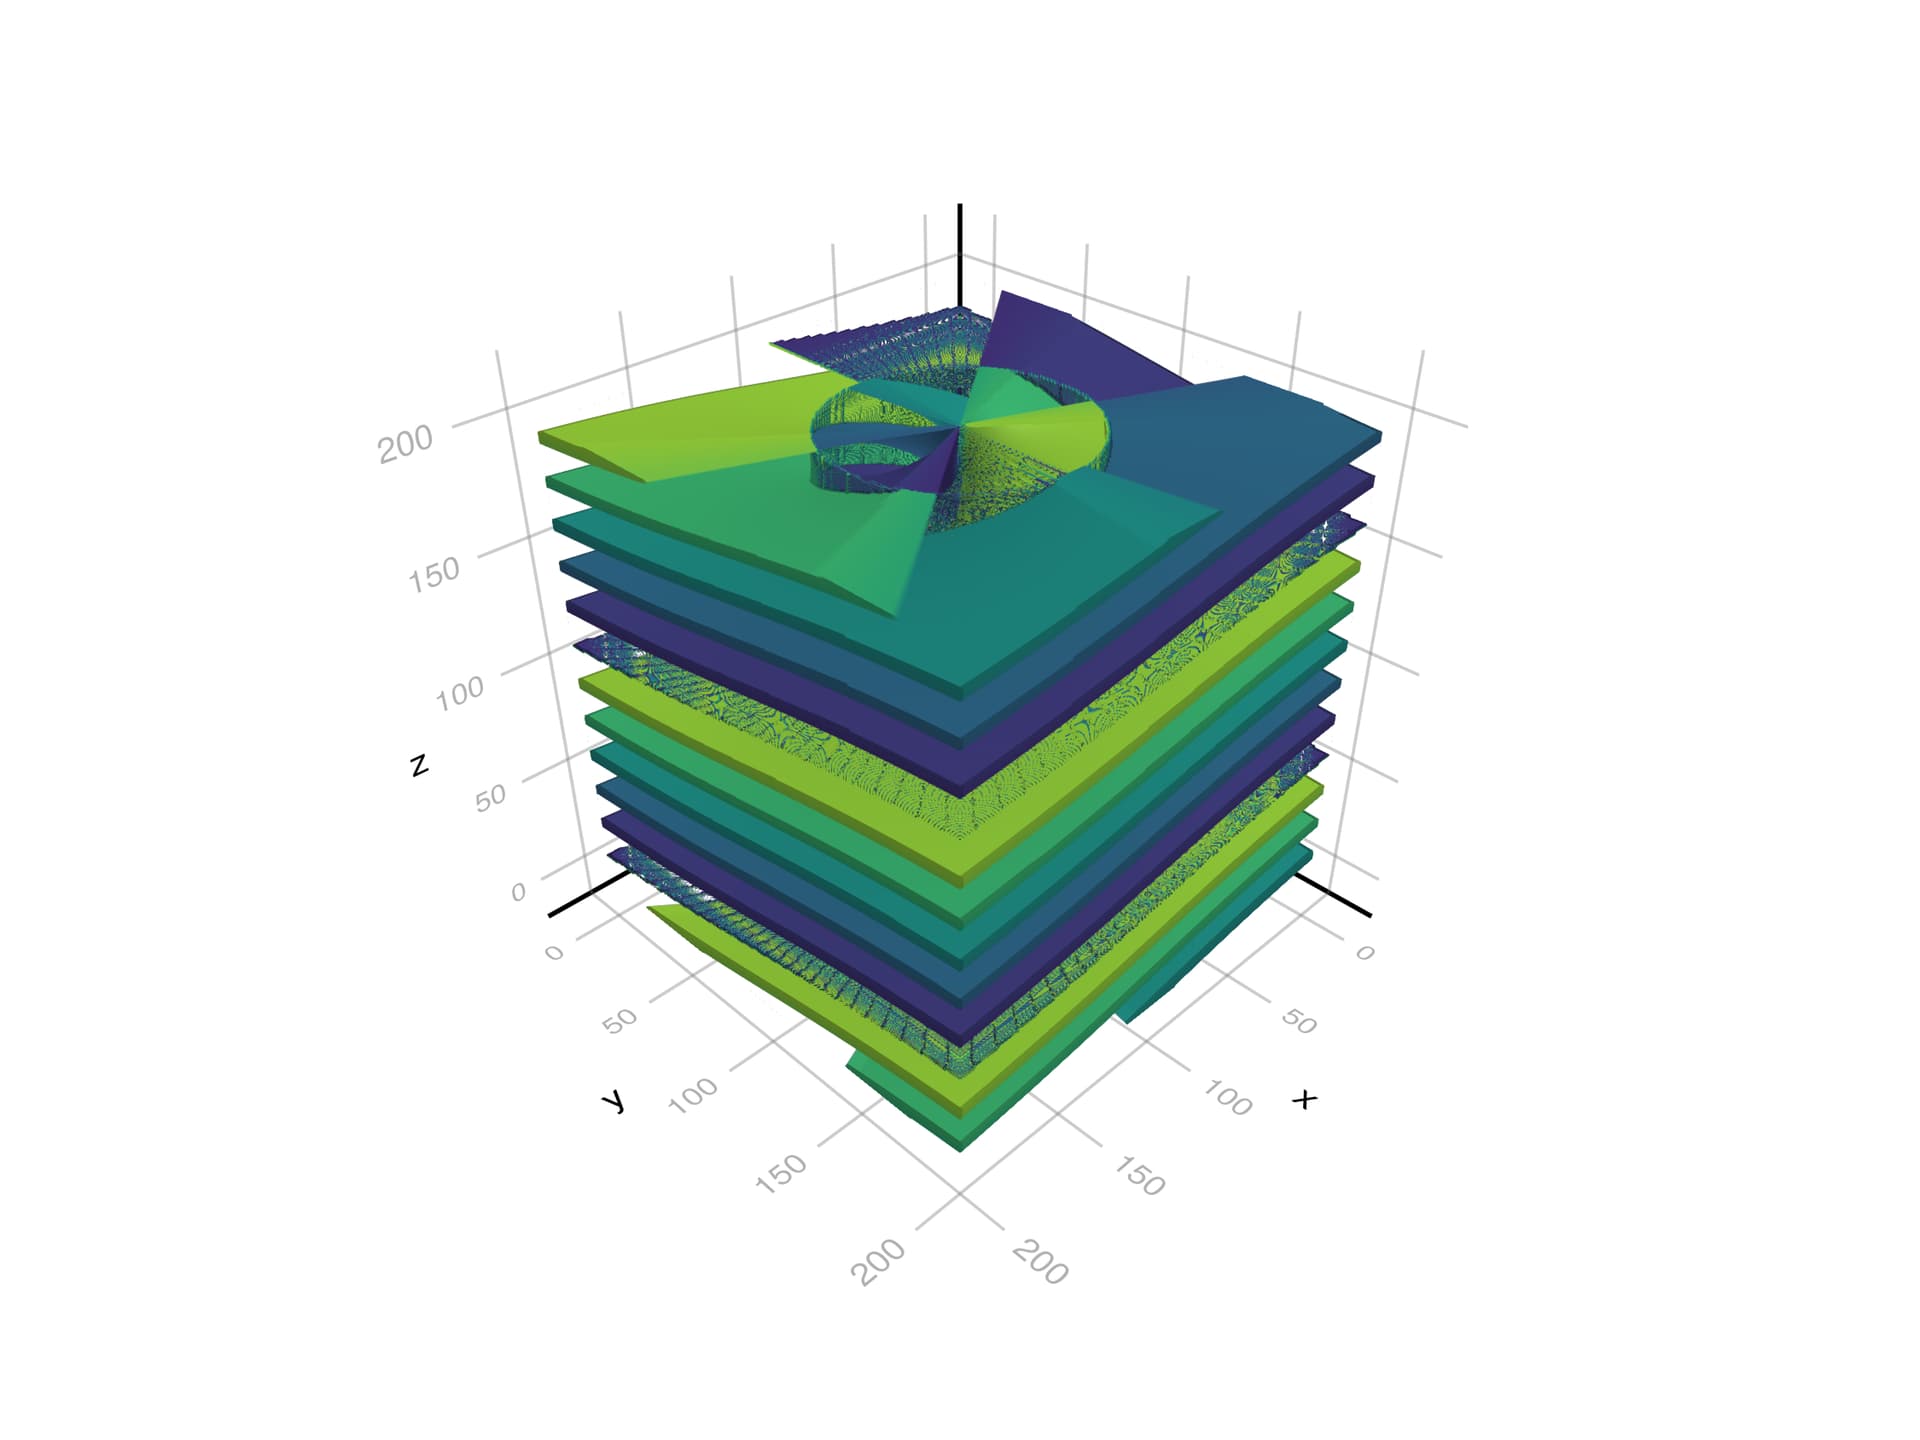
I don’t think this is an issue with the data. Filtering for a certain phase and then scattering
idxs_0 = filter(ijk -> -0.025 < ph[ijk...] < 0.025,
                  collect(Iterators.product(1:200, 1:200, 1:200)))
scatter(idxs_0)
yields a clean plot…

Does anyone have any experience in dealing with this issue?
Any suggestions on how to proceed are welcome!