Thanks for your suggestion.
Avoiding zero gives me a better plot(((k+1/2)*\pi<\alpha[k]<(k+3/2)*\pi)
using Roots, Plots
plotlyjs()
B = 1
Λ_s = 1
N = 100
v(y, t; B, α, Λ_s) = (B*y + 1)/(B + 1) - 2*sum(α_k -> sin(α_k*(1-y))/(α_k*(1 + cos(α_k)^2/(B*(1-Λ_s*α_k^2)) + 2*B*Λ_s*sin(α_k)^2))*exp(-α_k^2*t), α)
# v(y, t; B, α, Λ_s) = (B*y + 1)/(B + 1) - 2*sum(α_k -> α_k ≈ 0 ? 1 : sin(α_k*(1-y))/(α_k*(1 + cos(α_k)^2/(B*(1-Λ_s*α_k^2)) + 2*B*Λ_s*sin(α_k)^2))*exp(-α_k^2*t), α)
f(x) = tan(x) + x/(B*(1-Λ_s*x^2))
α = zeros(N)
for k in 1:N
α[k] = find_zero(f, (nextfloat(π*(k+3//2)), prevfloat(π*(k+1//2))))
end
# print(α)
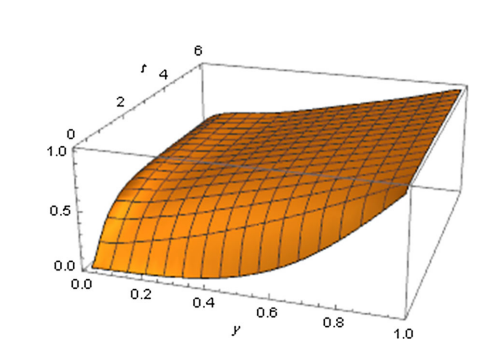
plot(range(0,1,100), range(0,6,100), (y,t)->v(y, t; B, α, Λ_s); seriestype=:surface)
The above gives

While the true plot as reported in the article is
Probably some other root-finding method will be needed. I would like to find roots in (0<\alpha[k]<(k+1/2)*\pi). It seems like the above method is not working.