I have a code written with CUDA.jl and I am trying to improve its performance. Upon CUDA.@profile, I learned that more than 60% of the host-side activity was spent on cudaMemcpyAsync:
julia> CUDA.@profile myfun(...)
...
Host-side activity: calling CUDA APIs took 397.28 ms (79.03% of the trace)
┌──────────┬────────────┬───────┬─────────────────────────────────────────────┬──────────────────────────┐
│ Time (%) │ Total time │ Calls │ Time distribution                           │ Name                     │
├──────────┼────────────┼───────┼─────────────────────────────────────────────┼──────────────────────────┤
│   60.98% │  306.54 ms │   200 │   1.53 ms ± 1.53   (  0.01 ‥ 3.22)          │ cudaMemcpyAsync          │
│    6.55% │   32.92 ms │  8502 │   3.87 µs ± 9.99   (  2.62 ‥ 921.49)        │ cuLaunchKernel           │
│    2.21% │    11.1 ms │ 81120 │ 136.82 ns ± 4582.86 (   0.0 ‥ 1.30391121e6) │ cuStreamGetCaptureInfo   │
│    0.50% │    2.49 ms │   800 │   3.11 µs ± 2.03   (  1.43 ‥ 22.65)         │ cuMemAllocFromPoolAsync  │
│    0.46% │     2.3 ms │   600 │   3.83 µs ± 1.01   (   3.1 ‥ 23.37)         │ cudaLaunchKernel         │
│    0.08% │  413.42 µs │   800 │ 516.77 ns ± 224.04 (238.42 ‥ 2622.6)        │ cudaStreamIsCapturing    │
...
I would like to reduce the number of cudaMemcpyAsync calls, but I am struggling to find out where it is called. The CUDA documentation says the function “[c]opies data between host and device.” I am not using any custom CUDA kernels, so I think copying between the host and device occurs only through copyto!() in my code. However, when I profile copyto!() between the host and device in either direction, I don’t see cudaMemcpyAsync is being used:
julia> d = CUDA.rand(1024,1024,1024);

julia> h = rand(Float32, 1024,1024,1024);

julia> CUDA.@profile copyto!(d, h)
Profiler ran for 895.97 ms, capturing 23 events.

Host-side activity: calling CUDA APIs took 895.87 ms (99.99% of the trace)
┌──────────┬────────────┬───────┬────────────────────────┐
│ Time (%) │ Total time │ Calls │ Name                   │
├──────────┼────────────┼───────┼────────────────────────┤
│   99.99% │  895.86 ms │     1 │ cuMemcpyHtoDAsync      │
│    0.00% │    2.38 µs │     1 │ cuStreamSynchronize    │
│    0.00% │  238.42 ns │     1 │ cuStreamGetCaptureInfo │
└──────────┴────────────┴───────┴────────────────────────┘

Device-side activity: GPU was busy for 894.8 ms (99.87% of the trace)
┌──────────┬────────────┬───────┬──────────────────────────────────┐
│ Time (%) │ Total time │ Calls │ Name                             │
├──────────┼────────────┼───────┼──────────────────────────────────┤
│   99.87% │   894.8 ms │     1 │ [copy pageable to device memory] │
└──────────┴────────────┴───────┴──────────────────────────────────┘

julia> CUDA.@profile copyto!(h, d)
Profiler ran for 835.24 ms, capturing 30 events.

Host-side activity: calling CUDA APIs took 797.95 ms (95.54% of the trace)
┌──────────┬────────────┬───────┬────────────────────────────────────┬────────────────────────┐
│ Time (%) │ Total time │ Calls │ Time distribution                  │ Name                   │
├──────────┼────────────┼───────┼────────────────────────────────────┼────────────────────────┤
│   95.53% │  797.92 ms │     1 │                                    │ cuMemcpyDtoHAsync      │
│    0.00% │    7.63 µs │     2 │   3.81 µs ± 0.0    (  3.81 ‥ 3.81) │ cuStreamSynchronize    │
│    0.00% │  238.42 ns │     1 │                                    │ cuStreamGetCaptureInfo │
└──────────┴────────────┴───────┴────────────────────────────────────┴────────────────────────┘

Device-side activity: GPU was busy for 796.72 ms (95.39% of the trace)
┌──────────┬────────────┬───────┬──────────────────────────────────┐
│ Time (%) │ Total time │ Calls │ Name                             │
├──────────┼────────────┼───────┼──────────────────────────────────┤
│   95.39% │  796.72 ms │     1 │ [copy device to pageable memory] │
└──────────┴────────────┴───────┴──────────────────────────────────┘
Where is cudaMemcpyAsync typically used in CUDA.jl? I dug in the CUDA.jl repository but could not find any explicit usage of the function.
More generally, are there ways to identify Julia functions in one’s code that call CUDA functions like cudaMemcpyAsync?
We don’t, so this is probably being called by a CUDA library. Some GPU-unfriendly operations actually fall back to computing on the CPU (like SVD, IIRC), which can require copies like that. Maybe you can identify it by looking at the number of calls, or by adding NVTX ranges to your application.
I was able to identify one place where cudaMemcpyAsync is used: normalize!:
julia> d = CUDA.rand(1024);

julia> CUDA.@profile normalize!(d)
Profiler ran for 1.98 s, capturing 39 events.

Host-side activity: calling CUDA APIs took 223.64 µs (0.01% of the trace)
┌──────────┬────────────┬───────┬───────────────────────────────────────┬──────────────────────────┐
│ Time (%) │ Total time │ Calls │ Time distribution                     │ Name                     │
├──────────┼────────────┼───────┼───────────────────────────────────────┼──────────────────────────┤
│    0.01% │   99.18 µs │     1 │                                       │ cudaFuncGetAttributes    │
│    0.00% │   57.94 µs │     3 │  19.31 µs ± 11.62  (  5.96 ‥ 27.18)   │ cudaLaunchKernel         │
│    0.00% │   40.53 µs │     2 │  20.27 µs ± 3.71   ( 17.64 ‥ 22.89)   │ cudaMemcpyAsync          │
...
Is this something expected? If so, is there a way to perform normalize! on a CUDA array without copying data between the host and device? I call normalize! in a loop, so this is quite costly.
UPDATE. I find that norm also uses cudaMemcpyAsync:
julia> CUDA.@profile norm(d)
Profiler ran for 801.43 ms, capturing 28 events.

Host-side activity: calling CUDA APIs took 170.23 µs (0.02% of the trace)
┌──────────┬────────────┬───────┬───────────────────────────────────────┬──────────────────────────┐
│ Time (%) │ Total time │ Calls │ Time distribution                     │ Name                     │
├──────────┼────────────┼───────┼───────────────────────────────────────┼──────────────────────────┤
│    0.01% │    68.9 µs │     1 │                                       │ cudaFuncGetAttributes    │
│    0.00% │   39.58 µs │     2 │  19.79 µs ± 0.34   ( 19.55 ‥ 20.03)   │ cudaMemcpyAsync          │
│    0.00% │    36.0 µs │     2 │   18.0 µs ± 16.35  (  6.44 ‥ 29.56)   │ cudaLaunchKernel         │
...
Ah right, I wasn’t familiar. Well, in that case the reason is simple: CUBLAS.nrm2 (as used by norm as used by normalize!) reduces to a scalar, so the operation needs to wait for the GPU to finish before being able to copy the scalar result back. All that time is “hidden” behind the time it takes to cudaMemcpyAsync, but that doesn’t mean the operation itself takes that long. This is clear when looking at the device results, which show how the copy only takes a fraction of the time it takes to execute the two kernels:
julia> CUDA.@profile CUBLAS.nrm2(d)
Profiler ran for 5.03 ms, capturing 29 events.

Host-side activity: calling CUDA APIs took 5.02 ms (99.66% of the trace)
┌──────────┬────────────┬───────┬──────────────────────────────────────┬─────────────────────────────┐
│ Time (%) │ Total time │ Calls │ Time distribution                    │ Name                        │
├──────────┼────────────┼───────┼──────────────────────────────────────┼─────────────────────────────┤
│   98.38% │    4.95 ms │     2 │   2.48 ms ± 3.49   (  0.01 ‥ 4.94)   │ cudaMemcpyAsync             │
│    0.75% │   37.67 µs │     1 │                                      │ cudaFuncGetAttributes       │
│    0.45% │   22.65 µs │     2 │  11.32 µs ± 8.94   (  5.01 ‥ 17.64)  │ cudaLaunchKernel            │
│    0.04% │    2.15 µs │     1 │                                      │ cudaEventRecord             │
│    0.02% │  953.67 ns │     5 │ 190.73 ns ± 199.48 (   0.0 ‥ 476.84) │ cudaStreamGetCaptureInfo_v2 │
│    0.02% │  953.67 ns │     1 │                                      │ cudaStreamSynchronize       │
│    0.00% │  238.42 ns │     4 │   59.6 ns ± 119.21 (   0.0 ‥ 238.42) │ cudaGetLastError            │
└──────────┴────────────┴───────┴──────────────────────────────────────┴─────────────────────────────┘

Device-side activity: GPU was busy for 4.94 ms (98.14% of the trace)
┌──────────┬────────────┬───────┬────────────────────────────────────┬────────────────────────────────────────────────
│ Time (%) │ Total time │ Calls │ Time distribution                  │ Name                                          ⋯
├──────────┼────────────┼───────┼────────────────────────────────────┼────────────────────────────────────────────────
│   98.09% │    4.94 ms │     2 │   2.47 ms ± 3.49   (   0.0 ‥ 4.93) │ _Z18nrm2_64addr_kernelIfffLi1ELi0ELi128EEv16c ⋯
│    0.04% │    1.91 µs │     1 │                                    │ [copy device to pageable memory]              ⋯
│    0.01% │  715.26 ns │     1 │                                    │ [copy pageable to device memory]              ⋯
└──────────┴────────────┴───────┴────────────────────────────────────┴────────────────────────────────────────────────
The 4.95 ms it “takes” to complete the cudaMemcpyAsync API call from the CPU’s point of view is actually 4.94 ms of kernel execution time + 1.91 µs of copy time.
The take away here is that you want to avoid synchronizing operations like that when possible. A “better” implementation of normalize! would compute the norm without synchronizing, and use that unmaterialized scalar as input to the normalization operation. These are the kind of things you may have to take into account when optimizing code for the GPU.
Thanks for the explanation! That makes sense. The only problem is that unlike your, my result does not show the matching host- and device-side timings:
Here, the host-side cudaMemcpyAsync took 904.08 µs, which is ~50X longer than the sum of the device-side times (14.31 + 1.91 + 1.19) µs. I am curious if you have any insights as to why this happens on my machine…
EDIT. I executed the code multiple times but got almost the same results, so I don’t think this is the time-to-first-plot (TTFP) issue.
All these operations happen as part of the CUBLAS nrm2 implementation, so it cannot be a Julia TTFP issue.
I’m not sure what’s happening here. At this point, I’d recommend moving to a more powerful profiler (NSight Systems), and hopefully the timeline reveals what’s up. The next / alternative step is to try this with a CUDA C reproducer, which should be easy enough (calling nrm2 on a large array is a simple sequence operations that ChatGPT or whatever could generate for you).
Also, could you post CUDA.versioninfo()? I want to ensure you’re using the latest version of the CUDA toolkit.
Sorry, last time I missed your request. Here is the requested CUDA version info:
julia> CUDA.@versioninfo()
ERROR: LoadError: UndefVarError: `@versioninfo` not defined
in expression starting at REPL[18]:1

julia> CUDA.versioninfo()
CUDA runtime 11.8, artifact installation
CUDA driver 12.2
NVIDIA driver 535.183.1

CUDA libraries:
- CUBLAS: 11.11.3
- CURAND: 10.3.0
- CUFFT: 10.9.0
- CUSOLVER: 11.4.1
- CUSPARSE: 11.7.5
- CUPTI: 18.0.0
- NVML: 12.0.0+535.183.1

Julia packages:
- CUDA: 5.4.2
- CUDA_Driver_jll: 0.9.0+0
- CUDA_Runtime_jll: 0.14.0+1

Toolchain:
- Julia: 1.10.1
- LLVM: 15.0.7

Preferences:
- CUDA_Runtime_jll.version: 11.8

2 devices:
  0: Tesla V100-PCIE-32GB (sm_70, 27.347 GiB / 32.000 GiB available)
  1: Tesla V100-PCIE-32GB (sm_70, 31.735 GiB / 32.000 GiB available)
I have been communicating with my supercomputer system admins for the past months, and I am finally able to get Nvidia Nsight profiling system running on the supercomputer. (In doing so, they found a number of bugs in Nsight that prevented them from running it on our system, which they reported to Nvidia.)
The executed REPL commands are
julia> d = CUDA.rand(1024);

julia> CUDA.@profile CUBLAS.nrm2(d);
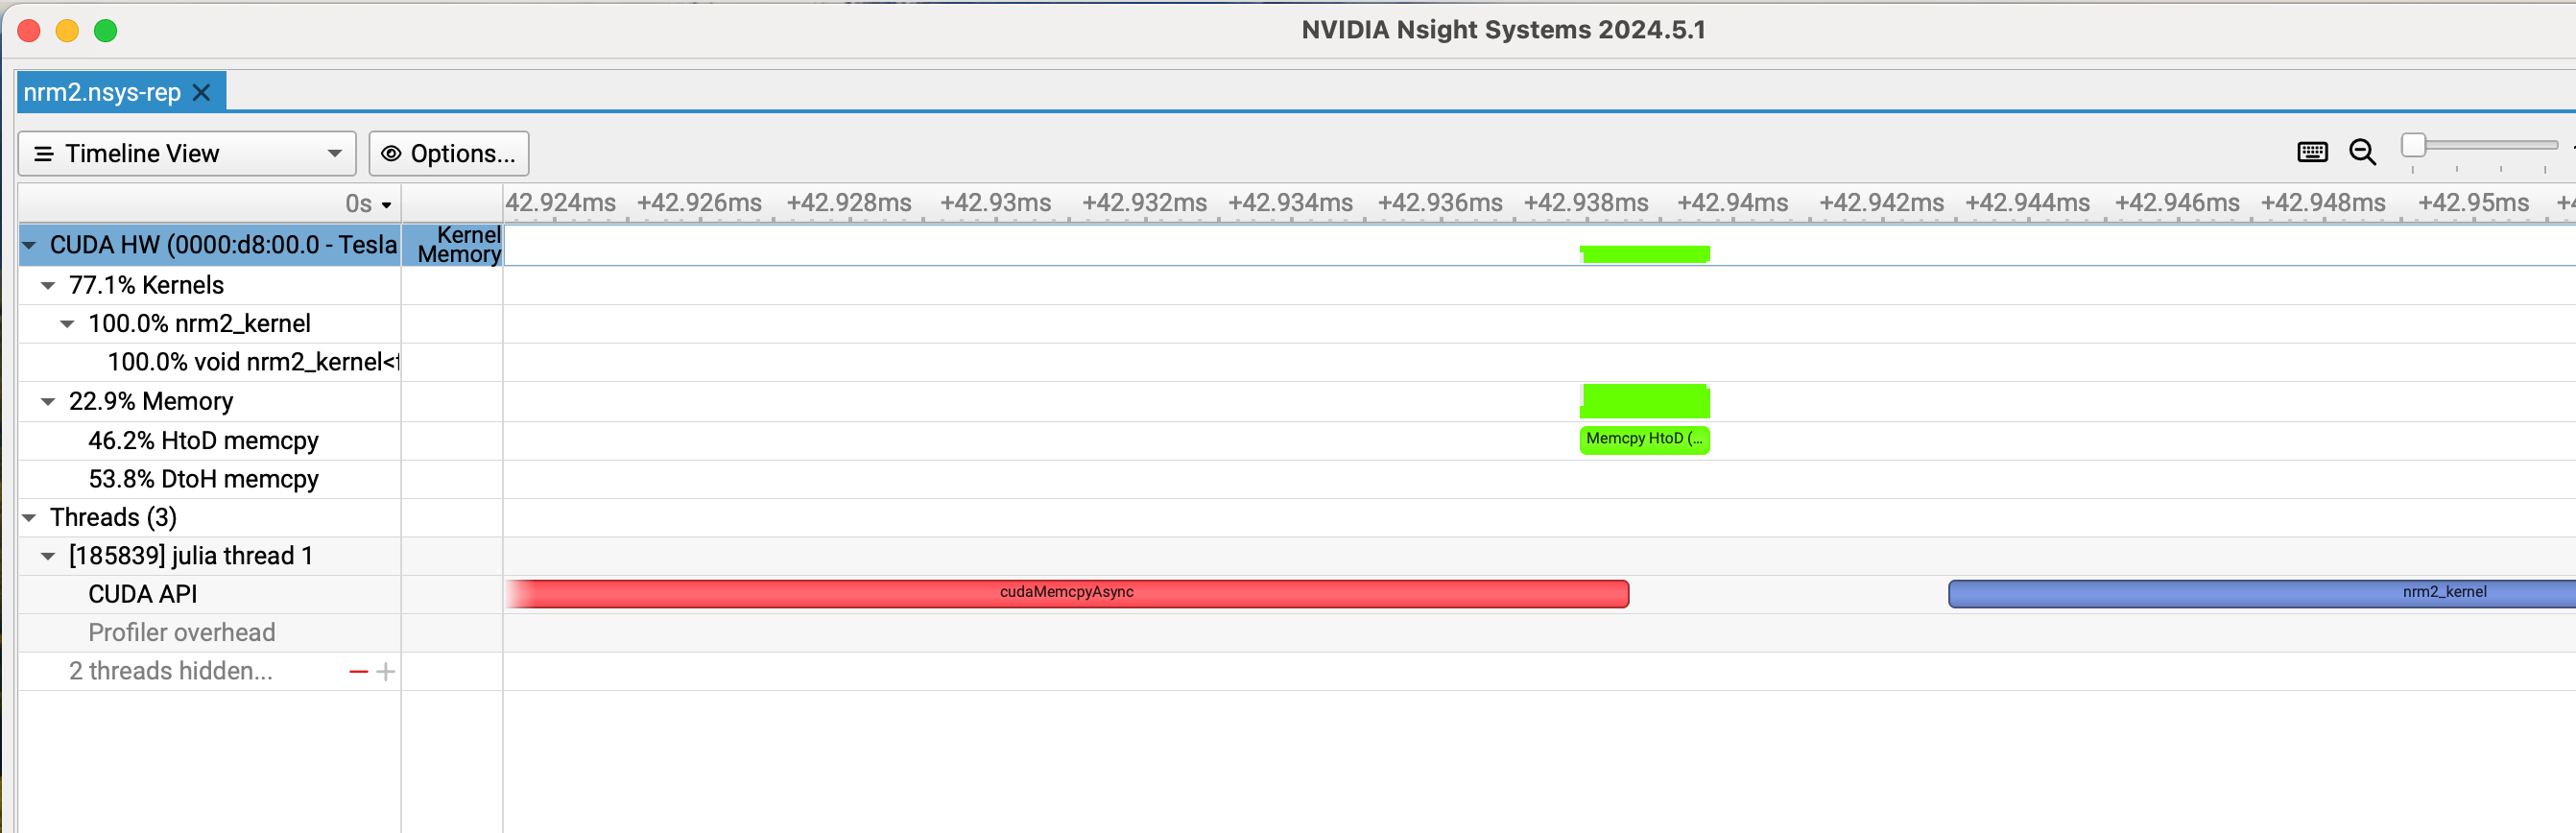
For the second command profiled here, Julia’s default profiler result I reported earlier showed two cudaMemcpyAsync calls on the host side and two kernel calls on the device side. The new information I obtained from Nsight is that the two kernels are executed after a very long first cudaMemcpyAsync (822 µs), and the second cudaMemcpyAsync takes much shorter (22 µs). The two red bubbles in the “CUDA API” row in the following screenshot corresponds to the two cudaMemcpyAsync calls (the first cudaMemcpyAsync bubble is truncated on the left to fit all the events of interest within the screen):
When zoomed in, the result shows that towards the end of the first cudaMemcpyAsync, Memcpy HtoD starts. Probably the first cudaMemcpyAsync was waiting for this to happen:
Is Memcpy HtoD the call to copy the vector d to the device? (I thought d = CUDA.rand(1024) would generate the vector directly on the device.)
If so, why doe it take so long for Memcpy HtoD to start after the first cudaMemcpyAsync is initiated?
This is first time I am using Nsight. If the person reading this is familiar with Nsight, I will appreciate if s/he advises me what else I need to pay attention to in the Nsight result to further understand this issue.
Are those among the first API calls? If so, try measuring two iterations of your main application and looking at the second one. The initial API calls are sometimes inexplicably slow.
To answer your other questions, you can try wrapping operations with an NVTX.@range "some name" CUDA.@sync begin ... end block; that will group the operations in the trace (the @sync isn’t strictly needed, but makes it easier to correlate the device and host traces, if you’re not very familiar with profiling asynchronous applications).
I have an important question on this. The function I really wanted to profile was LinearAlgebra.normalize!, because it is a function that is called in a loop in my package. As described earlier, I profiled the function as
julia> d = CUDA.rand(1024);

julia> CUDA.@profile normalize!(d);
Here, my expectation was that d = CUDA.rand(1024) would create a random vector on the device directly. Then, I expected that normalize!(d) would normalize the vector on the device, without having to copy anything from the host to the device or vice versa. Based on such an expectation, I wrote a package such that normalize!(d) is called repeatedly in a loop. Once all the calculations are finished, my package finally copies the result from d::CuVector to h::Vector by copyto!(h, d), assuming that CuVector lives on the device and Vector lives on the host. My intention was to minimize the number of communications between the host and the device, by doing all the calculations on the device (GPU) without communicating with the host and by transferring the calculated result back to the host only at the end of the calculation.
However, the above profiling result indicates that two copy operations (one from the host to the device and the other in the opposite direction) occur every normalize!(d) call. To further verify this observation, I did the following test:
julia> d = CUDA.rand(1024);

julia> CUDA.@profile begin
           for i = 1:3
               normalize!(d);
           end
       end
and the profiler shows that this code uses 6 copy operations (three from the host to the device, and the other three in the opposite direction). So, indeed normalize! seems to use two copy operations between the host and the device every time it is called.
This is strange, because normalization of a device vector d is an operation that can be carried out completely on the device, without having to communicate anything to or from the host: it just needs to calculate the norm of the device vector d, and then needs to divide the device vector by the norm. Why does it need to communicate any information back and forth between the host and device every time it is executed? Does it mean that the CUDA implementation of normalize! is suboptimal? Or, are there any ways to avoid this unnecessary communication between the host and device during normalize! performed on the device?
That’s a fair expectation, but not true because of how LinearAlgebra.jl implements normalize!, first fetching the scalar norm before using that to change the elements. It would be relatively straightforward, and a good optimization to add an implementation to GPUArrays.jl that’s optimized for GPUs by keeping the operations fully asynchronous. The current situation isn’t “strange” though, we’re just re-using the existing, generic implementation (one of the strengths of Julia) which works fine but happens to be slightly suboptimal for use on GPUs.
Where do we need asynchronous operations? normalize! should calculate the norm of a d::CuVector on a GPU and divide d by the calculated norm. Because no communication between the host and device is needed at all during the entire normalize! operation, I don’t think there is anything that can be done asynchronously. I don’t have much experience in parallel computing, though, so I could be wrong.
By not waiting for the norm calculation to finish in order to fetch a scalar, you keep the sequence asynchronous. That’s what you are after, right, by saying you want to avoid CPU-GPU communication?
If the scalar you are referring to is the norm, I’m not sure if there are any operations we can do inside normalize! while the norm is being calculated. normalize!(d) basically performs d .= d ./ norm(d), and the division can be done only after norm(d) is calculated.
Also, I don’t think the CPU–GPU communication needs to be avoided by asynchronous operations, because I feel normalize!(d) can be completely done on GPU, once d::CuVector is loaded on GPU. Specifically, n = norm(d) is calculated on GPU, but why does it have to be sent to CPU and back to GPU? Can’t n be stored in GPU and used directly to divide the elements of d with?
Or, is the CPU–GPU communication here sending something else than n, maybe d itself? I don’t want the normalized d to be sent to the host right after normalize!(d), because I have other GPU operations to perform on d. I want to copy the device vector d::CuVector to a host vector h::Vector only after all the GPU operations on d are finished.
@eldee, this is cool, but do we have to store any calculated scalar in a length-1 CuVector in order to prevent it from being sent to the host, even if the scalar is not one of the return values of a function?
For example, in the following code
function my_normalize2!(d::CuVector)
    n = norm(d)
    d ./= n

    return nothing
end
are you implying that n is sent to the host, even though it is only used inside my_normalize2! and not returned to the caller of my_normalize2!?