Log 02: July 13th, 2025 - Weather Imagineering
After tinkering further with OpenMeteo, I decided to take a break and determine what data I want exactly. I concluded that basically, this is the information I want from the Weather Forecast API:
Location
latitude=42.3751longitude=-71.1056
Daily Variables Requested
temperature_2m_max: Daily maximum temperature at 2 meterstemperature_2m_min: Daily minimum temperature at 2 meterssunset: Time of sunsetsunrise: Time of sunrisewind_speed_10m_max: Maximum wind speed at 10 meterswind_gusts_10m_max: Maximum wind gusts at 10 meterswind_speed_10m_min: Minimum wind speed at 10 meterswind_gusts_10m_min: Minimum wind gusts at 10 meters
Hourly Variables Requested
temperature_2m: Temperature at 2 metersuv_index: UV indexprecipitation_probability: Probability of precipitationprecipitation: Amount of precipitationrelative_humidity_2m: Relative humidity at 2 meterswind_speed_10m: Wind speed at 10 meterswind_direction_10m: Wind direction at 10 meters
Other Options
timezone=America/New_York: Output times in the Eastern Time zone (encoded as%2F)forecast_days=3: Request a 3-day forecasttimeformat=unixtime: Timestamps in Unix time format (seconds since epoch)wind_speed_unit=mph: Wind speeds in miles per hourtemperature_unit=fahrenheit: Temperatures in Fahrenheitprecipitation_unit=inch: Precipitation in inches
Curl Request Example:
curl https://api.open-meteo.com/v1/forecast?latitude=42.3751&longitude=-71.1056&daily=temperature_2m_max,temperature_2m_min,sunset,sunrise,wind_speed_10m_max,wind_gusts_10m_max,wind_speed_10m_min,wind_gusts_10m_min&hourly=temperature_2m,uv_index,precipitation_probability,precipitation,relative_humidity_2m,wind_speed_10m,wind_direction_10m&timezone=America%2FNew_York&forecast_days=3&timeformat=unixtime&wind_speed_unit=mph&temperature_unit=fahrenheit&precipitation_unit=inch
And Air Quality API:
Hourly Variables Requested
us_aqi: U.S. Air Quality Index (based on EPA standards)
Other Options
forecast_days=3: Request a 3-day forecast
Curl Request Example:
curl https://air-quality-api.open-meteo.com/v1/air-quality?latitude=52.52&longitude=13.41&hourly=us_aqi&forecast_days=3
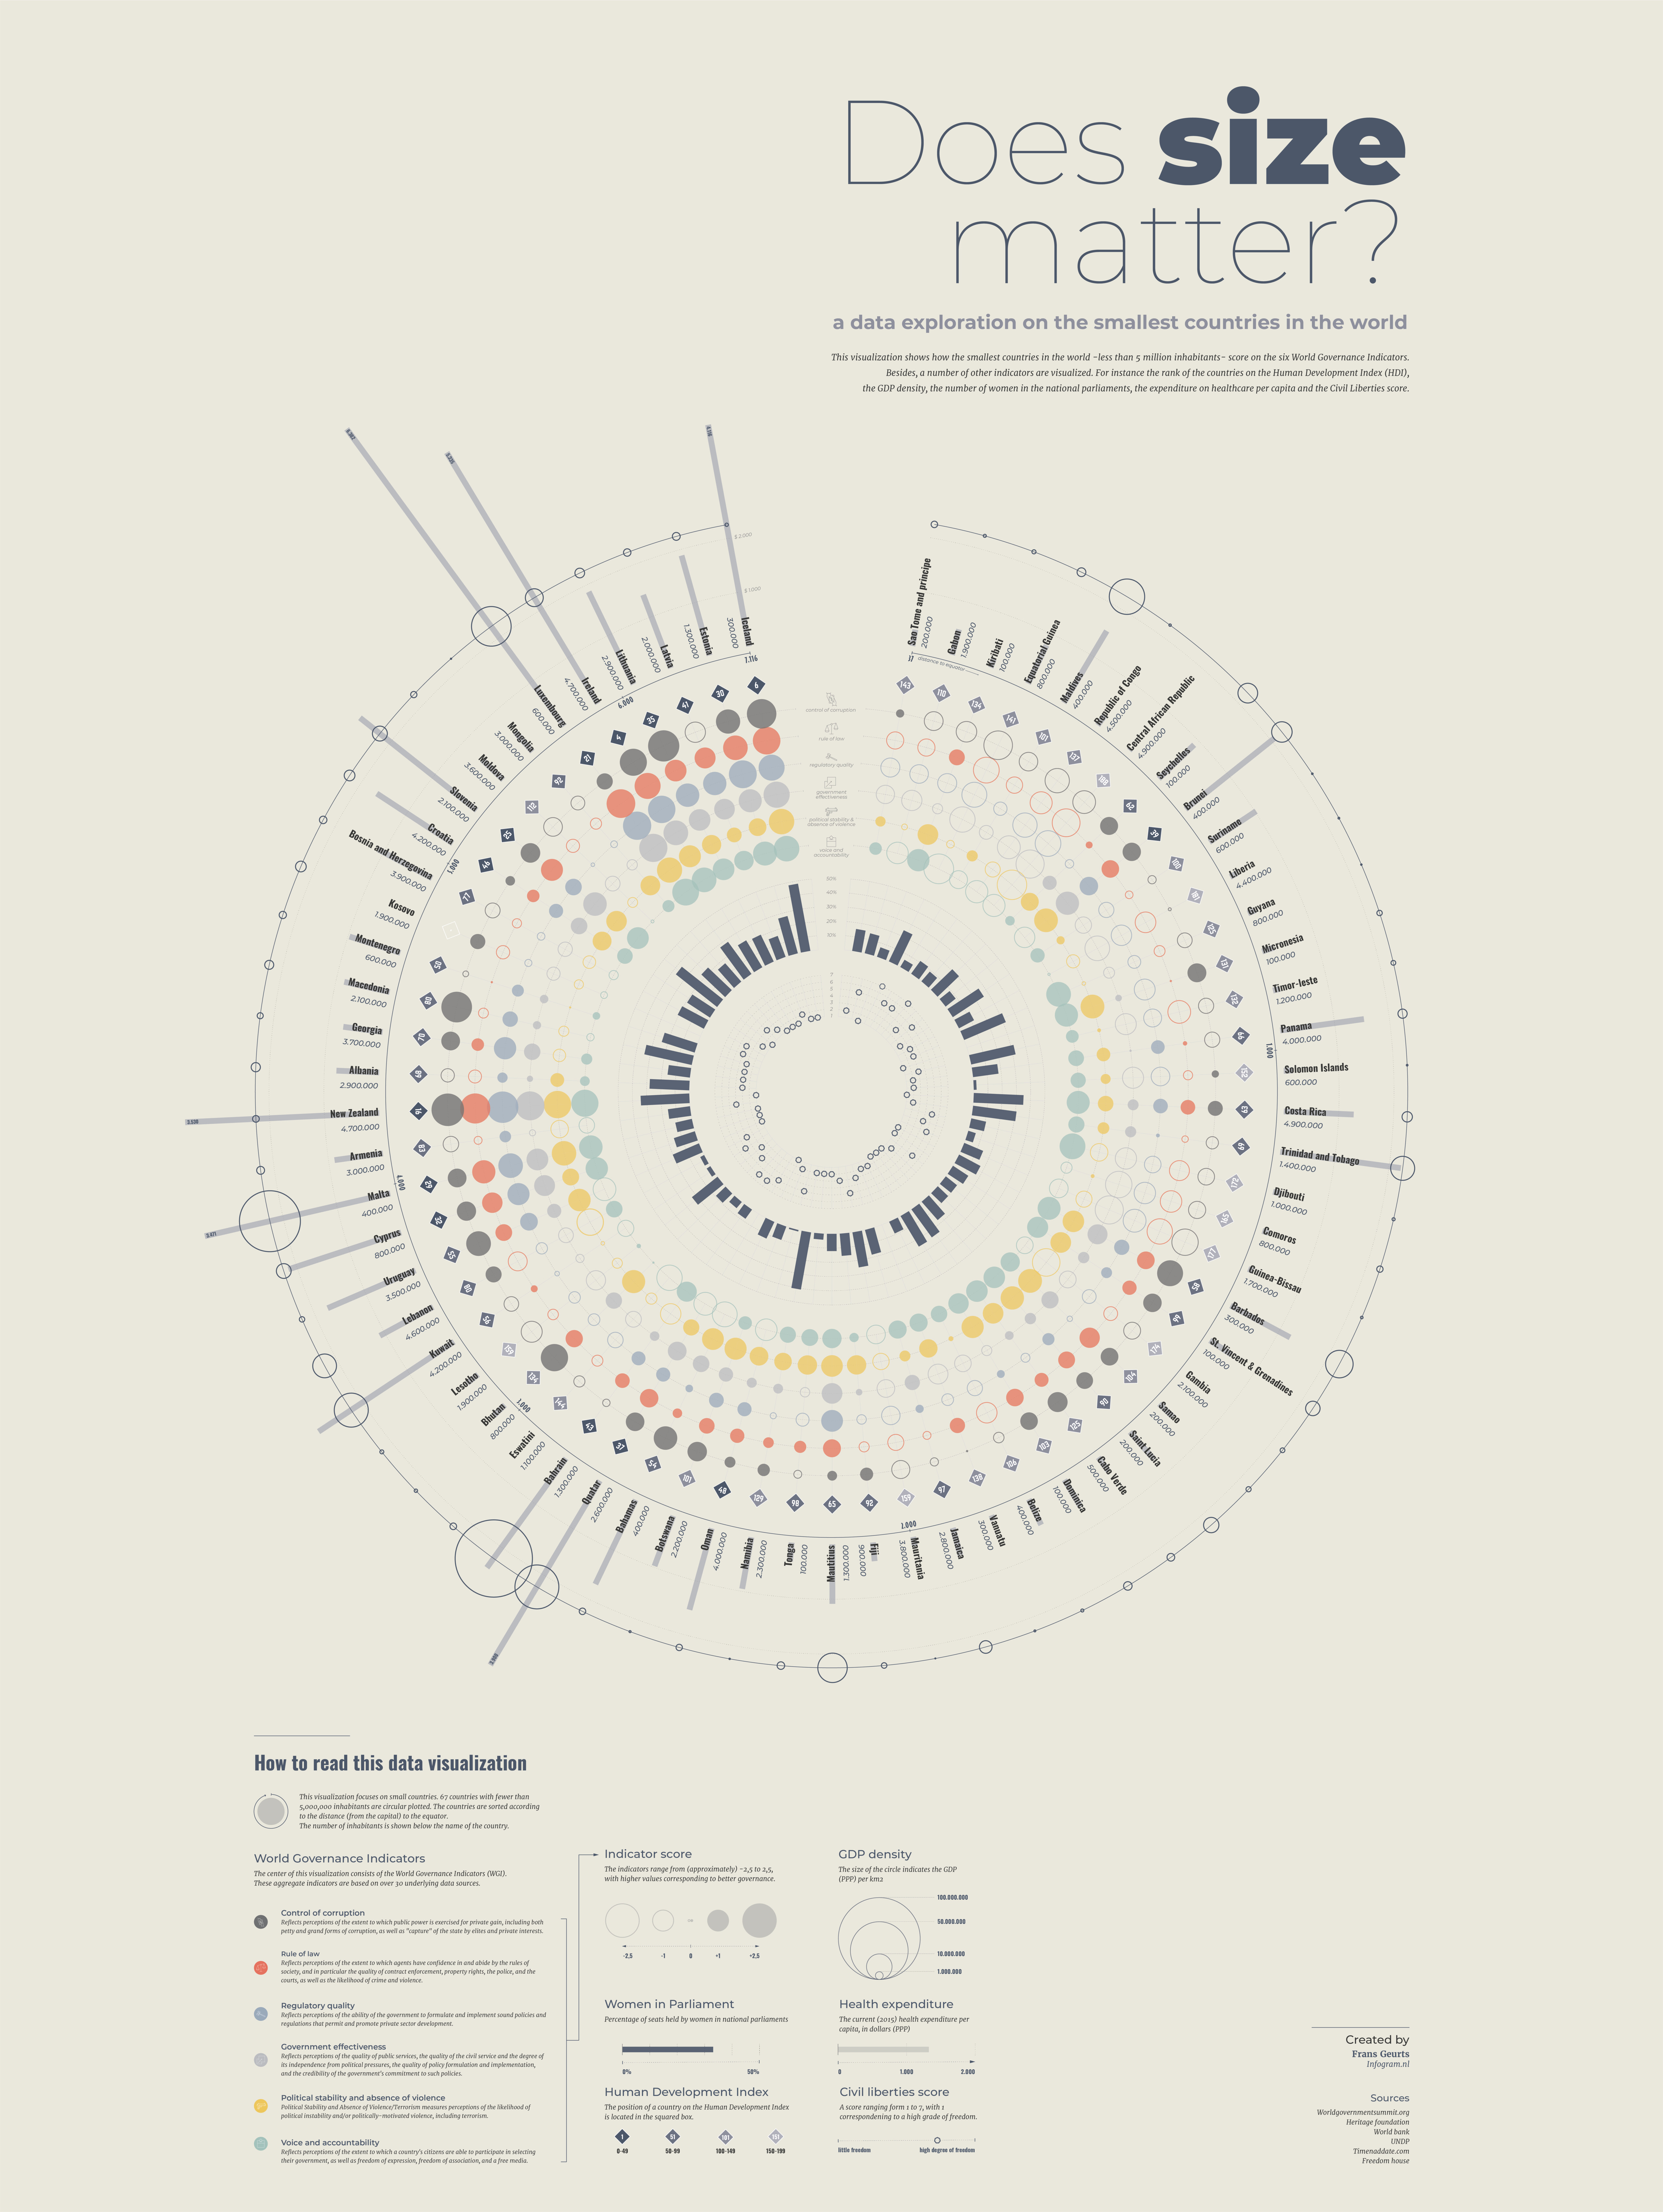
From there, I began tinkering with how to display this data on my display. I sketched out a small draft of this here:

Basically, I am imagining using Makie.jl and a PolarAxis radial chart to display this information (thanks to @asinghvi17 and @sdanisch for the tips here):
You can make multiple polar axes and use PolarAxis | Makie
In my designing, I found this example to be beautiful and something I could base my work off of:

I also found this other example which was also hugely inspiring:
This will be a task for future TCP.
Finally, I decided to put some thoughts to code and began drafting a Jinkies.jl framework for how to “chunk” the regions of an e-ink display. As of now, I have two structs called Display and another called Component. Display holds information about the e-ink display and what components are in the display. A Component holds plotting information about what goes into the display and where.
I am imagining making Component’s more like an interface too so I can make any component that could be rendered to an image using tools like Makie, Luxor, and more.
Currently, I have made a PrettyTables.jl interface to represent an e-ink display’s pixels in a coarser granularity than pixel dimensions. Here’s how things look so far:
julia> Jinkies.set_display_grid!(100, 120)

E-Ink Display Grid
┌─────┬─────┬─────┬─────┬─────┬─────┬─────┬─────┬─────┐
│     │ 001 │ 002 │ 003 │ 004 │ 005 │ 006 │ 007 │ 008 │
├─────┼─────┼─────┼─────┼─────┼─────┼─────┼─────┼─────┤
│  1  │  ⬤  │  ⬤  │  ⬤  │  ⬤  │  ⬤  │  ⬤  │  ⬤  │  ⬤  │
├─────┼─────┼─────┼─────┼─────┼─────┼─────┼─────┼─────┤
│  2  │  ⬤  │  ⬤  │  ⬤  │  ⬤  │  ⬤  │  ⬤  │  ⬤  │  ⬤  │
├─────┼─────┼─────┼─────┼─────┼─────┼─────┼─────┼─────┤
│  3  │  ⬤  │  ⬤  │  ⬤  │  ⬤  │  ⬤  │  ⬤  │  ⬤  │  ⬤  │
├─────┼─────┼─────┼─────┼─────┼─────┼─────┼─────┼─────┤
│  4  │  ⬤  │  ⬤  │  ⬤  │  ⬤  │  ⬤  │  ⬤  │  ⬤  │  ⬤  │
└─────┴─────┴─────┴─────┴─────┴─────┴─────┴─────┴─────┘
And then for colors, I can do something like this to say where a part of an e-ink display already has a component:
julia> Jinkies._update_display_grid_colors!(
    [[1,1], [1,2],[2,1],[2,2]]
)
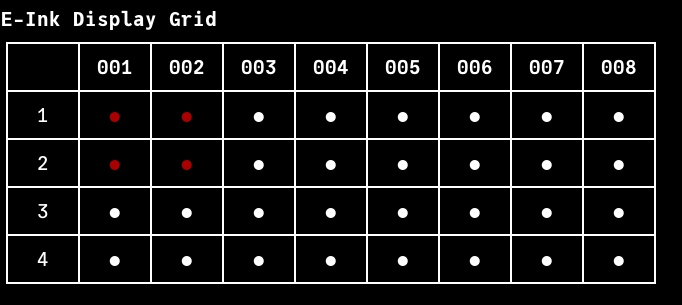
I like the display representation so far, but I need to mess around a bit further with the component and display interplay. Also encoding what information should be stored here and there.
And that is where we shall leave the dev log for now. Nice day of exploring, hacking, and imagineering! Onwards!