
good night friends.
I’m working with some images (mandril and lighthouse)
and I want to do the procedure as the diagram shows.
Could someone help me …
I’m not good at programming in Julia. And I would like to learn to do that kind of process.
good night friends.
I’m working with some images (mandril and lighthouse)
and I want to do the procedure as the diagram shows.
Could someone help me …
I’m not good at programming in Julia. And I would like to learn to do that kind of process.
do you have any working code?
as such, no.
I have a code but it does not cover everything that says that, the specific steps indicated in the diagram, I am not clear how to use it in a single code, where I do the whole process and go by showing the images on how the procedures are performed.
what I have of code.
using Images, ImageView, TestImages, Plots,StatsBase,
img = testimage(“mandrill”)
imshow(img)
img = Gray.(testimage("mandrill"))
histogram(vec(reinterpret(UInt8, img)))

vals = imhist(img).


img = testimage("mandril")

plot(leg=:none)  # abre el GKS QtTerm (a donde se realizara el histograma

for (comp, col) = zip([red, green, blue], [RGB(1,0,0), RGB(0,.8,0), RGB(0,0,1)])
         hist = fit(Histogram, reinterpret.(comp.(vec(img))), 0:256).weights
     plot!(hist, c=col, f=(0, RGBA(col, 0.5)))
	end
gui()

vals = imhist(img).

    img = TestImage("mandrill")
img2 = Gray.(img)
img3 = 255 .* img2
img4 = convert.(Float64,img3)
img3 = broadcast(x->Int(x.val.i),img2)
can you help me with this problem?
Hi Gerson,
I’m not sure that I am interpreting the diagram correctly because some of the steps don’t seem to make sense. For example, R1 seems to be the result of adding a linear stretched image and a histogram equalized image, but R2 then immediately subtracts the histogram equalized image yielding just the linear stretched image?! Be that as it may, here is how you would go about performing my interpretation of the steps outlined in the diagram:
using ImageContrastAdjustment, Images, ImageFiltering, TestImages, ColorTypes, HistogramThresholding
const ICA = ImageContrastAdjustment

function example()
    img = testimage("mandril")

    # Grayscale image.
    imgg = Gray.(img)

    # Linear contrast stretching.
    imggₗ = ICA.adjust_histogram(ICA.LinearStretching(), imgg)

    # Histogram Equalization.
    imggₑ = ICA.adjust_histogram(ICA.Equalization(), imgg)

    #=
       If you are adding two images together you need to decide how you will deal
       with values that exceed the the maximum intensity. For example, what
       should happen if you add two completely white images together? If you
       add/subtract two Gray types then they will just over/under flow. E.g. see
       what happens when you do: Gray{N0f8}(0.8) + Gray{N0f8}(.4). Refer to the
       FixedPointNumbers.jl package for more information on what N0f8 is. I
       assume that you want to avoid underflow/overflow in your intermediate
       calculations and that you want to clamp the result back to the interval
       [0..1] after all of your subtractions/additions. Hence we shall convert to
       float and drop the Gray type wrapper for the intermediate calculations.
     =#
    R₁ = float.(imggₗ) + float.(imggₑ)

    # What is the purpose of this step in your diagram? We just get imggₗ as a result?
    R₂ = R₁ - float.(imggₑ)

    # This operation is now just equivalent to imggₗ + imggₗ + imggₑ.
    R₃ = R₁ + R₂

    # Applying a minimum filter.
    window_size = (-1:1, -1:1)
    imgmin = mapwindow(minimum, R₃, window_size)

    # Partition the interval from the smallest to largest value in imgmin into 256 bins.
    edges, counts = ICA.build_histogram(imgmin, 256, minval = minimum(imgmin), maxval = maximum(imgmin))

    #=
      The `counts` array stores at index 0 the frequencies that were below the
      first bin edge. Since we are seeking a threshold over the interval
      partitioned by `edges` we need to discard the first bin in `counts`
      so that the dimensions of `edges` and `counts` match.
    =#
    t = find_threshold(Otsu(), counts[1:end], edges)

    # Apply the threshold to imgmin and visualize the result.
    img₀₁ = zeros(Gray{Bool}, axes(imgmin))
    for i in CartesianIndices(img)
        img₀₁[i] = imgmin[i] < t ? 0 : 1
    end
    display(img₀₁)
end

# I've put the example into a function to avoid issues with global scope variables.
example()
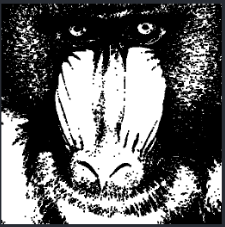
Here is the result on the mandril test image.
This is the link PROPOSED METHOD Automatic Thresholdwhere I am supported but the process that I want to do in July and with any image, for example, mandril … The code that you offer is very well put … but I think you do not explain. Excuse me but I’m new working in Julia[PROPOSED METHOD Automatic Threshold]
i have one error
julia> function example()
img = testimage(“mandril”)
ERROR: syntax: incomplete: “function” at REPL[13]:1 requires end
Did you copy and paste the entire post into the REPL, or are you typing and evaluating each line? I suggest you familiarize yourself with Juno, save what I wrote as a .jl file and then open and run it inside Juno.
I haven’t had time to glance at the link you sent me but it is possible that they want to clip values to the interval [0..1] when adding/subtracting images so you may not want to convert to float like I have done according to my interpretation.
I’m going through line with line,
and I’m working in Julia
Version 1.1.0 (2019-01-21)
in console mode.