This disscusion presents a way to use annotations to create a multi-colored title, but I have some issues creating annotations on plots that have been modified. Here is a minimal reproducible example using Julia 1.7.2.
using Plots
#gr() # The same issue is also present in the gr backend
pyplot()

function make_plot(X, Y, add_plot=true)

    p = plot()
    if add_plot
        plot!([1,2],[1,2])
    end
    tc = [:red, :black, :orange]
    for (i,s) in enumerate(["text", "with", "color"])
        annotate!(0.25*i , 0.5, text(s, tc[i], 18))
    end
    return p
end

plot1 = make_plot([1], [1], true)
plot2 = make_plot([1], [1], false)
plot(plot1, plot2)
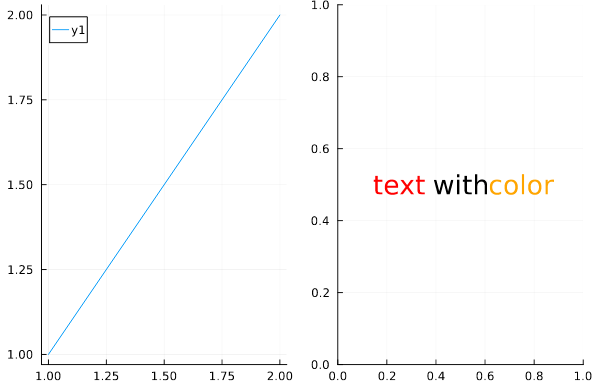
I would have expected the text to appear on top of the line, but instead it is nowhere. Any suggestions?
(PS: If anyone knows a better way to create a multi-colored title using pyplot btw, that would also be welcome.)