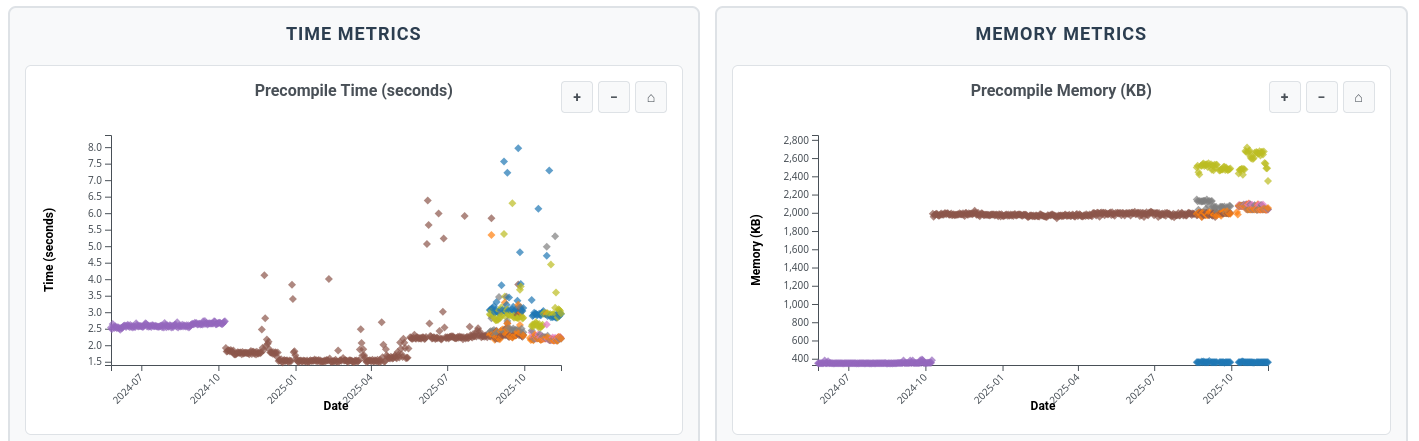
At Julia Ecosystem Benchmarks Explorer you can find detailed benchmarks of loading time for many packages over many different versions of julia, all interactively explorable.
No. For each historic date I check out the General registry to its state on that date, and set it as the source of truth in the active julia depot. So all version resolutions happen as if it was that date. I manually put bounds on which date corresponds to which julia version, so a julia version is never tested on a General registry state that did not exist during the julia version lifetime.
I use juliaup so I never manually bisected or compiled julia. There are many failures for many packages throughout this dataset, but they are just not visualized. I did not investigate why exactly the failures happen.
All the benchmarks run on a lab server in the back of my office. The historical data (about a 1000 General registry snapshots) took a week or two. Now every night another benchmark run is executed (for lts, nightly, alpha, and release, as defined by juliaup).
That particular server is used for other tasks as well, most of them not computationally intensive. But the benchmarks run at high process priority with reserved resources at night, so hopefully the noise is not too bad.
Interesting question how such data can be interpreted when packages get updated over time. You’d assume that new features might add loading time while authors should also try to battle TTFX. The daily nightly measurement that’s starting now should be useful to track behavior of Julia over time. But in the historic data it seems difficult to make assessments. I’ll have to play around a little.
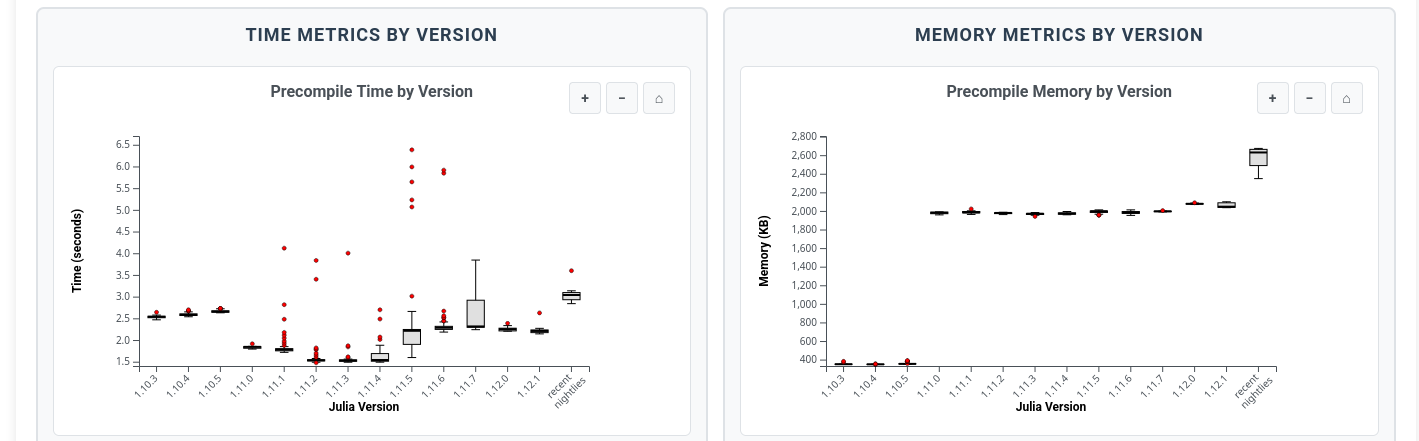
Here’s an alternative visualization. I thought that it might make sense to normalize because the packages and workloads are so different. So I took the median of a given metric within each package/workload/julia group, then rescaled those medians within each package group by dividing with the maximum value. So each package has values going up to 1 with the relative proportions between the values staying intact. The thick dots are then means over all those values for a given julia version, the small dots are the values making up the means.
There’s still considerable variation and I’m not sure if another way of normalization might be better, but at least it does reduce the impact of the different orders of magnitude of the workloads. Maybe scaling by a reference version like latest release would also work.
If I understand your description correctly, the main reason I avoided this type of normalization is that package that support only recent julia versions make the plot incorrectly look like loading times are going up.
E.g. we have a package that supports 1.8 for which the averages are (1.0, 0.1, 0.2, 0.3, 0.3) and a package that supports 1.10 for which the averages are (missing, missing, 0.9, 1.0, 1.0), falsely pulling the summary averages way up.
Yeah I noticed that effect, too and this normalization is definitely a bit simplistic. Maybe zscoring would be better or something else entirely. But just taking averages let’s the large workloads dominate the rest