Hello,
I am trying to use vspan to highlight specific periods in a plot with dates as x axis. It seems that vspan changes the y axis units to dates also (which is wrong).
MWE :
# Show vspan problem with date abscissaes
using Plots
using Dates

gr()
#ENV["GKSwstype"]="nul" # from batch / no X11
#ext=".svg"
ext=".png"
sf=true


y=[1.0*i*i for i in 1:10]
@. y= -y + 5.0

# x=[i+0.0 for i in 1:10]
x=[Date(2019,11,i) for i in 1:10]

rx=[x[3],x[5]]
ry=[y[3],y[5]]

p=plot(x,y, label="y", title="Vspan problem with dates")
if sf; savefig(p,"p-plot"*ext); end

p=vspan!(p,rx,label="",alpha=0.2)
if sf; savefig(p,"p-vspan"*ext); end
Here is the (incorrect ?) result
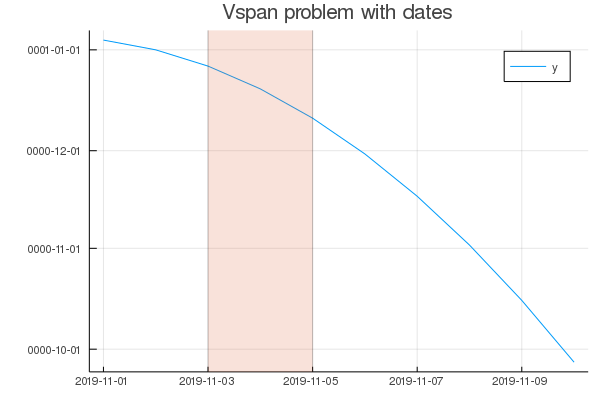
What can I do to go around this ?
Thanks in advance,