Is there a way to make a stacked histogram in Makie like Stacked histogram on a log scale — seaborn 0.13.2 documentation?

The documentation only has examples about multiple histograms.
Is there a way to make a stacked histogram in Makie like Stacked histogram on a log scale — seaborn 0.13.2 documentation?
The documentation only has examples about multiple histograms.
Maybe @jling knows how one can do that in FHist.jl?
If there is no way to do it in Makie directly I can write a patch for Makie.
Something along these lines
using CairoMakie, StatsBase

function stacked_hist!(ax, datasets; bins, colors)
    @assert length(datasets) == length(colors)

    edges = collect(bins)
    counts = [fit(Histogram, d, edges).weights for d in datasets]
    M = hcat(counts...)
    C = cumsum(M; dims=2)

    width = edges[2] - edges[1]
    centers = @view(edges[1:end-1]) .+ width/2

    for i in eachindex(centers)
        bottom = 0.0
        for j in 1:size(C,2)
            top = C[i,j]
            # rectangle polygon corners
            x0 = centers[i] - width/2
            x1 = centers[i] + width/2
            poly!(ax,
                  Point2f[(x0,bottom), (x1,bottom), (x1,top), (x0,top)],
                  color = colors[j])
            bottom = top
        end
    end
    ax
end
f = Figure()
ax = Axis(f[1,1], xlabel="Value", ylabel="Count")

stacked_hist!(ax,
    [randn(1000), randn(1000) .+ 1, randn(1000) .+ 2];
    bins = -4:0.5:6,
    colors = [:tomato, :dodgerblue, :seagreen]
)

f
I wrote a PR for multi-histogram plot in Makie:
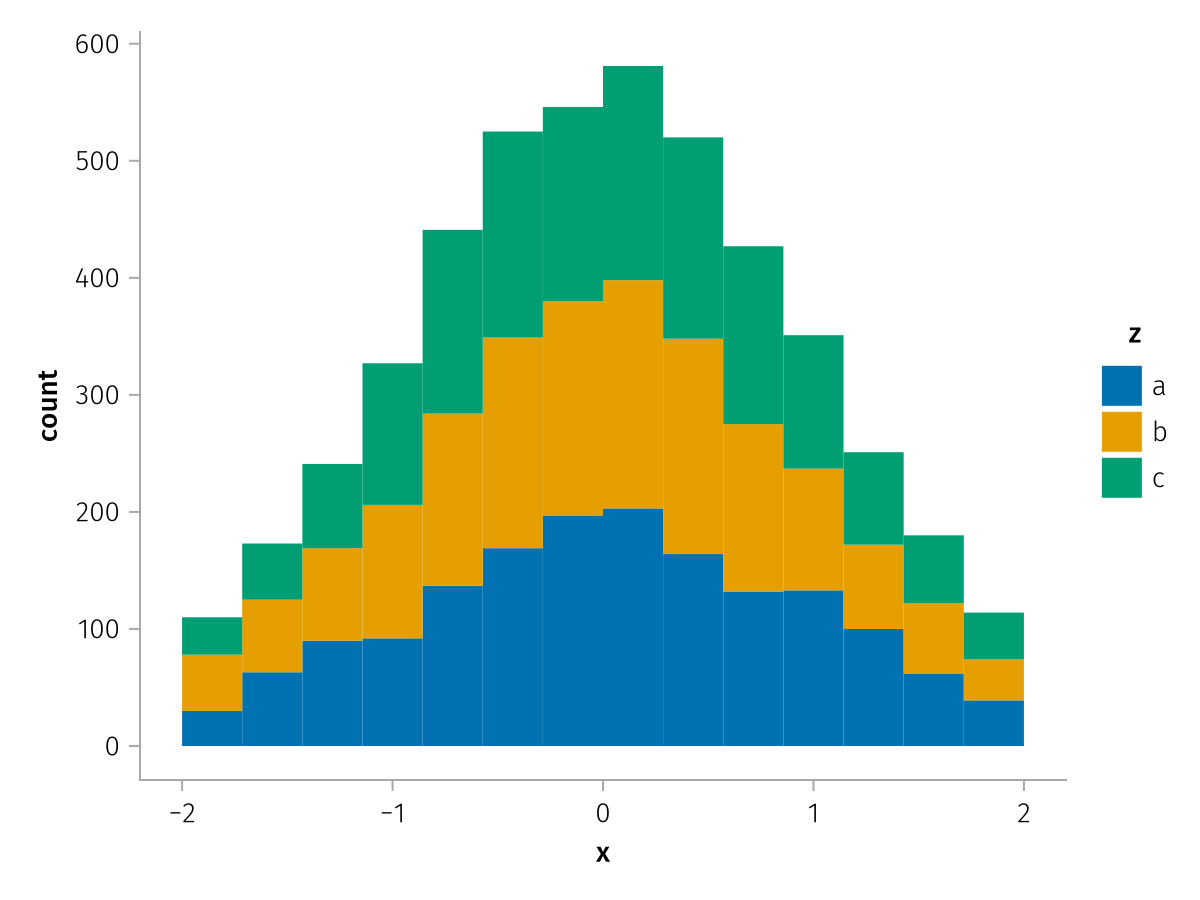
I’m pretty sure AoG can do this, see the third plot in the histogram docs: Analyses | AlgebraOfGraphics
specs = data(df) * mapping(:x, stack=:z, color=:z) * histogram()
draw(specs)