What do you mean by “solution” here? You are not actually solving the system (unless you want to trace out the line by hand on your screen…) - maybe a more descriptive title would be better.
It doesn’t seem to me that there’s anything wrong in what Plots is doing here, but rather that Matlab (or whatever produced the plot in the book) is doing something more complicated: the plane which is increasing in z from left to right is plotted below the other plane on the left hand side of the figure, but plotted above on the right hand side. I don’t think you can achieve this automatically, maybe you have to plot one plane first, then the second over it, and then those bits of the first again which should be visible above the second?
The solution is only the intersection of the two planes. The matlab code is quite simple:
[x,y] = meshgrid(-5:0.5:5);
z = 2*x - 3*y + 2;
surf(x,y,z)

hold on
z = -2*x + 3*y;
surf(x,y,z)
I dont know if there are more behind the scenes. Just the linear system and the functions. Matlab only plots one plane after another. I think I did the same.
You might also consider using a different plotting backend; these will give different looking results based on which one you use. For example, using PlotlyJS:
using Plots; plotlyjs()
x = y = collect(-5:0.5:5)
f(x, y) = 2x - 3y + 2
g(x, y) = -2x + 3y

surface(x, y, f)
surface!(x, y, g)
This will allow you to move the camera at your will and get plots that look similar to what you desire (by clicking and dragging).
If you haven’t installed the PlotlyJS backend yet, you will have to do ] add PlotlyJS first.
but Im thinking about gr backend. Why it cant cross the two planes. I had already changed the view using camera=(x, y, z)… but the planes aparent are apart.
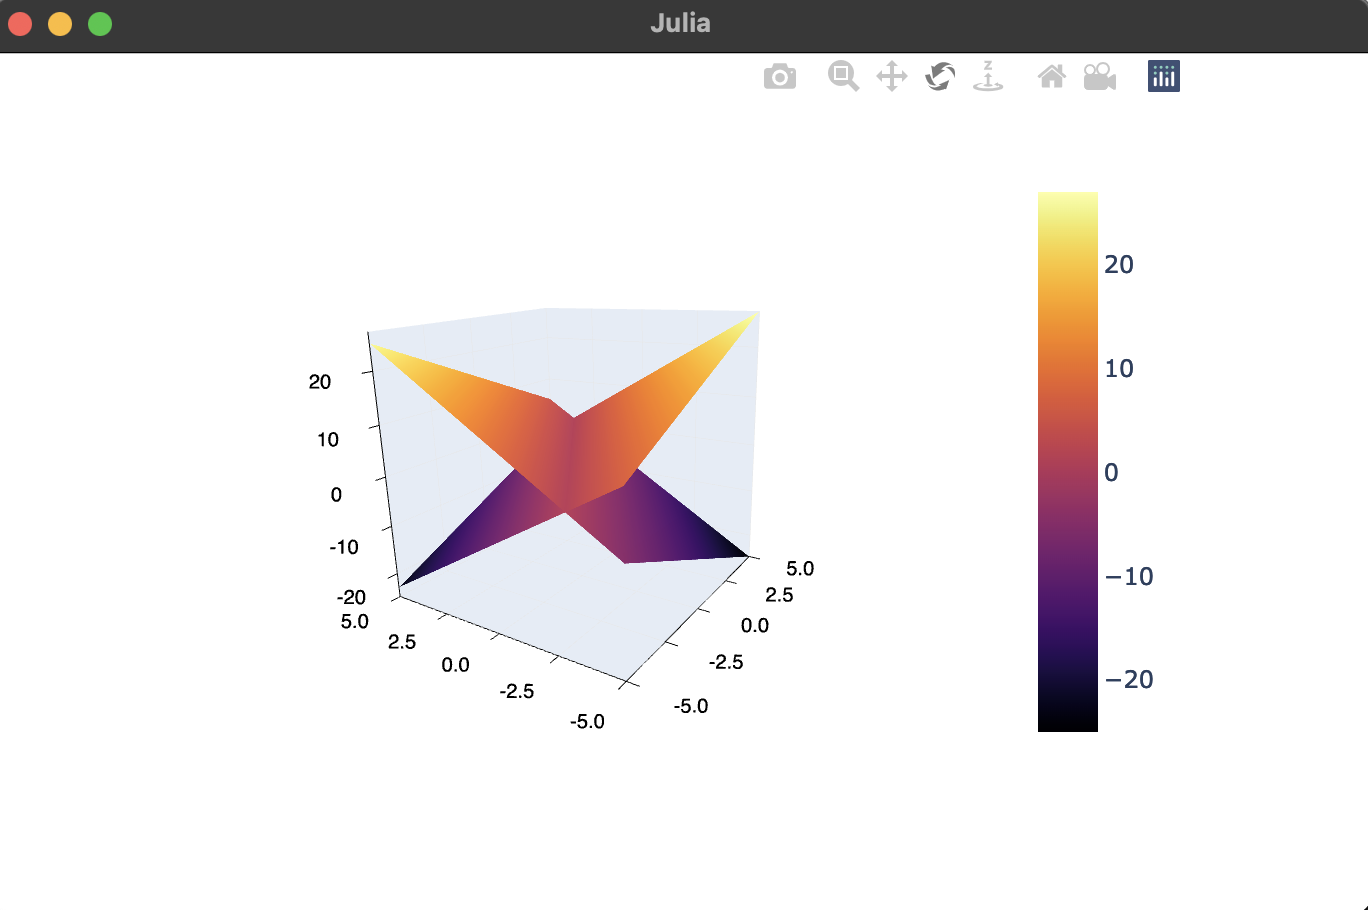
I agree that it’s challenging to get something nice looking with GR. I’ve been playing around with the camera and the alpha of each curve, and the axes aren’t quite cooperating…
using Plots; gr()
x = y = collect(-5:0.5:5)
f(x, y) = 2x - 3y + 2
g(x, y) = -2x + 3y

surface(x, y, f, alpha = 0.7, camera = (-5, -7))
surface!(x, y, g, alpha = 0.9)
which is not quite as nice as what PlotlyJS produces. One of the reasons PlotlyJS is nice in my opinion is that it allows for intuitive camera movement with the click-and-drag, and the axes don’t get jumbled up.
You can also do a wireframe on top of the surface:
using Plots; plotlyjs()
x = y = collect(-5:0.1:5)
f(x, y) = 2x - 3y + 2
g(x, y) = -2x + 3y

surface(x, y, f)
surface!(x, y, g)
wireframe!(x, y, f)
wireframe!(x, y, g)