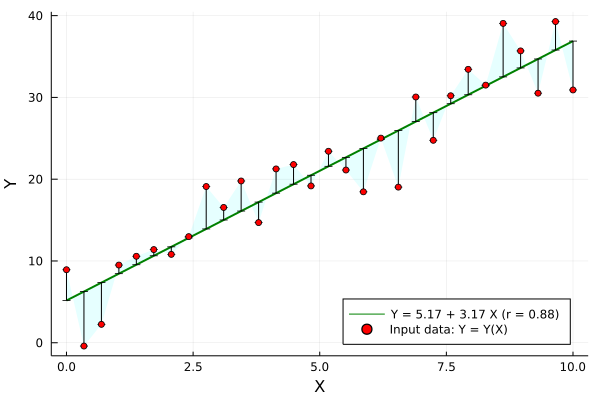
Just in case it might be useful, sharing one linear regression example below, where the correlation coefficient r is displayed and other regression statistics are computed too:
using Plots, Random, Distributions, GLM, DataFrames, Printf

# input data
n = 30
x = LinRange(0,1, n) .* 10
e = rand(Normal(0,mean(x)/4),n)
parms = Dict(:b0 => 6, :b1 => 3.2)
y = parms[:b0] .+ parms[:b1] .* x .+ 3*e
data = DataFrame(X=x, Y=y)

# linear regression
ols = lm(@formula(Y ~ 1 + X), data)
a, b = coef(ols)
r = r2(ols)

# plotting
yhat = parms[:b0] .+ parms[:b1] .* x
err = y - yhat; z0 = 0*err;
str = "Y = " * @sprintf("%.2f",a) * " + " * @sprintf("%.2f",b) * " X (r = " * @sprintf("%.2f",r) * ")"
plot(x,yhat, label=str, lw=2, c=:green, yerror=(z0,err), ribbon=(z0,err), fc=:cyan, fa=0.1)
scatter!(x, y, mc=:red, xlabel="X", ylabel="Y", label="Input data: Y = Y(X)", legend=:bottomright)
Some stats output after command:
julia> ols = lm(@formula(Y ~ 1 + X), data)

Y ~ 1 + X

Coefficients:
───────────────────────────────────────────────────────────────────────
               Coef.  Std. Error      t  Pr(>|t|)  Lower 95%  Upper 95%
───────────────────────────────────────────────────────────────────────
(Intercept)  5.16706    1.31032    3.94    0.0005    2.48298    7.85113
X            3.172      0.225023  14.10    <1e-13    2.71106    3.63294