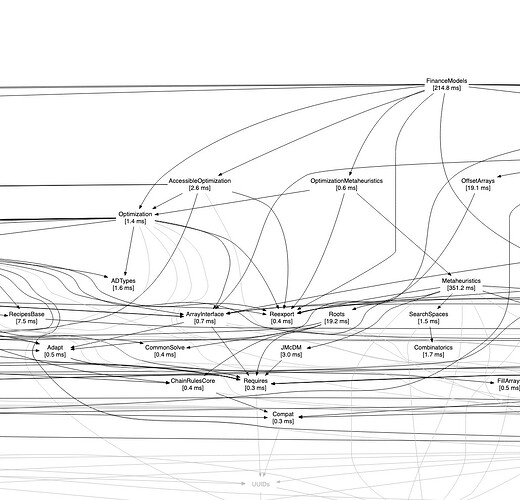
tl;dr - a script to plot dependencies and the associated @time_imports time.
I’m in the process of putting one of my packages through a diet and wanted to better understand the upstream dependencies and their impact on my TTFX. This isn’t the whole picture, but I hadn’t seen something like this shared before and wanted to post if helpful and maybe improve on it.
My package of interest right now is FinanceModels, so this will show an example as of FinanceModels v4.3.0.
Setup:
Create a temporary environment with your package of interest and PkgGraph.jl (thanks @tfiers! ).
In a REPL:
pkg> activate --temp
pkg> add PkgGraph FinanceModels
Generate a string representation of the dependencies and collect the import time:
julia> using PkgGraph
julia> dg = PkgGraph.depgraph_as_dotstr("FinanceModels",time=true)
julia> clipboard(dg)
Now, paste to https://dreampuf.github.io/GraphvizOnline/
This will create a zoomable SVG of the dependency graph. PNG subset shown here as an example:
