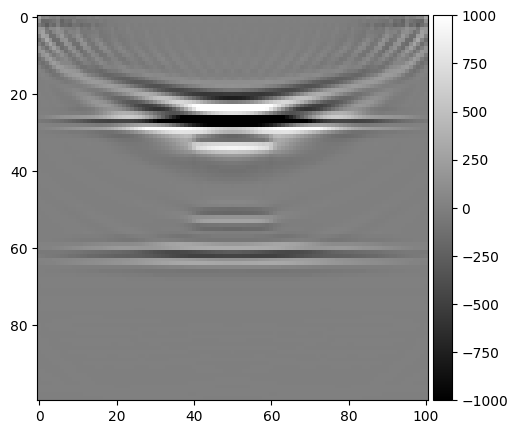
In PyPlot.jl when plotting a 2D matrix using imshow() you can set vmin and vmax wich acording to the official documentation: " vmin and vmax define the data range that the colormap covers."
Using this package I create the next figure:
fig=figure()
im = imshow(diff(data, dims=2)', vmin=-1e3, vmax=1e3, cmap="gray")
cb = colorbar(im)
So I tried to recreate it but using Makie, what I did was to normalize the data
data_ = diff(data, dims=2)
data_ = (data .- minimum(data)) / (maximum(data) - minimum(data));
data__ = data_ * (1e3 - (-1e3)) .+ (-1e3);
f = Figure(resolution = (500, 500))
ax, hm = heatmap(f[1, 1], data__, colormap=:grays, axis = (aspect = 1, yreversed = true))
Colorbar(f[1, 2], hm)
But the result is quite far from the desired:
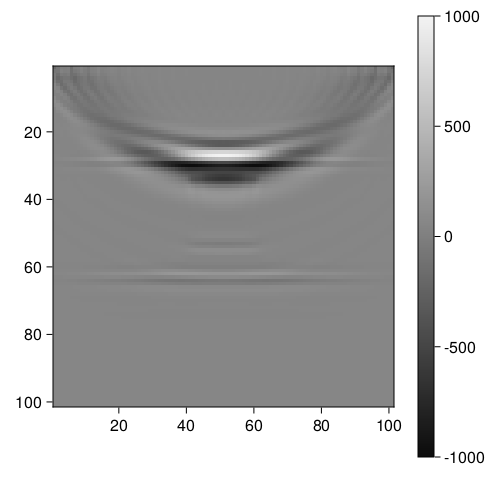
colorrange does not solve the problem, nor does it have to do with the colormap used, since plotting the normalized data with PyPlot yields a result similar to Makie.
This is the data.