The error in the following code.
ax.plot(xs, ys, zs) # no method found
Could anyone give me some help? Thanks!
using PyPlot; const plt = PyPlot
xs = Float64[]
ys = Float64[]
zs = Float64[]
# initialize xs, ys, zs
...

# show 3D line
fig = plt.figure()
ax = fig[:add_subplot](111, projection="3d")
ax.plot(xs, ys, zs)   # error, "type PyObject has no field plot "
The aforementioned code is from the following python example. Can anyone convert the following code from Python to Julia? Thanks
import matplotlib as mpl
from mpl_toolkits.mplot3d import Axes3D
import numpy as np
import matplotlib.pyplot as plt
mpl.rcParams['legend.fontsize'] = 10
fig = plt.figure()
ax = fig.gca(projection='3d')
theta = np.linspace(-4 * np.pi, 4 * np.pi, 100)
z = np.linspace(-2, 2, 100)
r = z**2 + 1
x = r * np.sin(theta)
y = r * np.cos(theta)
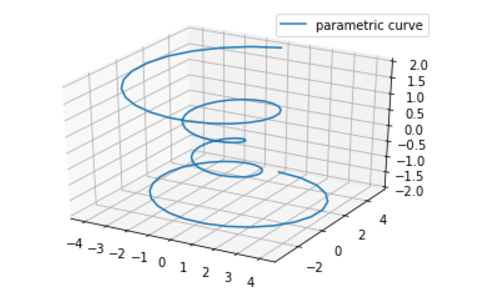
ax.plot(x, y, z, label='parametric curve')
ax.legend()
plt.show()
Shouldn’t that be plot3d instead of plot?
It is solved. The code is as following.
can use keys( obj ) to show the attributes and member functions of the PyObject.
using PyPlot; const plt = PyPlot

theta = collect( linspace( -4π, 4π, 100 ) )
z = collect( linspace(-2, 2, 100) )
r = z.^2 + 1;
x = r .* sin(theta)
y = r .* cos(theta)

fig = plt.figure()
ax = fig[:add_subplot](111, projection="3d")
ax[:plot](x, y, z)   # PyObject, use obj[:function_name] to call the member function
**# Code updated to Julia version:=0.7.0 for Matplotlib/PyPlot.version:=2.1.2 running on Python version:=3.6.4**

**# Updated Julia code by Marc Cox / MSC**

**# file: 3d-Matplotlib-PyPlot-example.jl**

**using PyPlot**

# Marc Cox / MSC add logging some basic debugging info

println("## START Running Marc Cox 3d-Matplotlib-PyPlot-example.jl")

println("## Julia VERSION:=", VERSION)

println("## matplotlib.__version__():=", matplotlib[:__version__] )

println("## Matplotlib/PyPlot.version:=", PyPlot.version)

# Original code shows deprecation warnings

# which become hard stop errors in Julia version 1.0+

# Warning: `linspace(start, stop, length::Integer)` is deprecated, use `range(start, stop=stop, length=length)` instead.

# theta = collect(Float16, linspace( -4π, 4π, 100 ) )

# println("## typeof(theta) :=", typeof(theta))

# z = collect(Float16, linspace(-2, 2, 100) )

# println("## typeof(z) :=", typeof(z))

#

# range(start; length, stop, step=1)

theta = collect(Float16, range( -4π, length=100, stop=4π) )

println("## typeof(theta) :=", typeof(theta))

z = collect(Float16, range( -2, length=100, stop=2) )

println("## typeof(z) :=", typeof(z))

#

# MSC reconsider #man-dot-operators-1 ,

# Source: https://docs.julialang.org/en/v1/manual/mathematical-operations/index.html#man-dot-operators-1

# More specifically MUST UNDERSTAND

# Dot Syntax for Vectorizing Functions #man-vectorized-1

# Source: https://docs.julialang.org/en/v0.6.1/manual/functions/#man-vectorized-1

# Therefore, any Julia function f can be applied elementwise to any array (or other collection)

# with the syntax f.(A).

# For example sin can be applied to all elements in the vector A, like so:

# julia> sin.(A)

# Warning: `a::AbstractArray + b::Number` is deprecated, use `a .+ b` instead.

r = z.^2 .+1;

println("## typeof(r), typeof(theta) :=", typeof(r), ", " ,typeof(theta))

# ORIGINAL WAS -- x = r .* sin(theta)

x = r.*sin.(theta)

# ORIGINAL WAS -- y = r .* cos(theta)

y = r.*cos.(theta)

# NOGO in Julia but Original OLD Python was -- fig = plt.figure()

# I feel like this should be more prominently explained in the documentation,

# but if you scroll down to the bottom of the Readme for PyCall (which PyPlot uses) it says:

# Important: The biggest difference from Python is that object attributes/members

# are accessed with o[:attribute] rather than o.attribute,

# so that o.method(...) in Python is replaced by o[:method](...)

fig = plt[:figure]()

#

# Source: https://github.com/JuliaPy/PyPlot.jl

# you must first call the using3D() function to ensure that mplot3d is loaded

using3D() # << WORKS AOK per shows 3D axes below ...

ax = fig[:add_subplot](111, projection="3d")

ax[:plot](x, y, z) # PyObject, use obj[:function_name] to call the member function

**println("## FINISHED Running Marc Cox 3d-Matplotlib-PyPlot-example.jl")**

println(" ")
