This is the first time I am writing a recipe and I am a bit lost in all the options. Basically I want to have a few convenient plotting functions for a package I am working on. It calculates solar positions, which are just tuples of (datetime, zenith, azimuth). Fairly straightforward.
My current attempt is this:
module SolarPositionMakieExt

using Dates, Tables, Makie
using SolarPosition
import SolarPosition: sunpathplot, sunpathplot!

_elevation_from_zenith(ze) = 90 .- ze

function _normalize_input(data, t_col)
    if Tables.istable(data)
        colnames = Tables.columnnames(data)
        t = Tables.getcolumn(data, t_col)
        az = Tables.getcolumn(data, :azimuth)

        if :zenith in colnames
            ze = Tables.getcolumn(data, :zenith)
            el = _elevation_from_zenith(ze)
        elseif :elevation in colnames
            el = Tables.getcolumn(data, :elevation)
            ze = 90 .- el
        else
            error("Need either :zenith or :elevation in table input.")
        end
    elseif data isa Tuple && length(data) == 3
        t, ze, az = data
        el = _elevation_from_zenith(ze)
    else
        error("Data must be a Tables.jl source or (time, zenith, azimuth) tuple.")
    end
    return t, ze, el, az
end

@recipe(SunpathPlot) do scene
    Theme(
        coords = :polar,      # :polar or :cartesian
        colormap = :twilight,
        markersize = 3,
        t_col = :datetime,
    )
end

function sunpathplot(data; coords = :polar, kwargs...)
    if coords === :polar
        fig = Figure()
        ax = PolarAxis(fig[1, 1])
    else
        fig = Figure()
        ax = Axis(fig[1, 1])
    end
    sunpathplot!(ax, data; coords = coords, kwargs...)
    return fig
end

function sunpathplot!(ax, data; coords = :polar, t_col = :datetime, kwargs...)
    t, ze, el, az = _normalize_input(data, t_col)
    vals = dayofyear.(t)

    if coords === :polar
        if !(ax isa PolarAxis)
            error("Axis must be a PolarAxis for polar coordinates")
        end

        # configure polar axis for solar paths
        ax.direction = -1
        ax.theta_0 = -π / 2
        ax.rlimits = (0, 90)
        x = deg2rad.(az)
        y = ze
    else
        if !(ax isa Axis)
            error("Axis must be a regular Axis for cartesian coordinates")
        end
        x = az
        y = el
    end

    scatter!(
        ax,
        x,
        y;
        color = vals,
        colormap = get(kwargs, :colormap, :twilight),
        markersize = get(kwargs, :markersize, 3),
    )
end

# fallback method for when no axis is provided
function sunpathplot!(data; coords = :polar, kwargs...)
    ax = current_axis()
    sunpathplot!(ax, data; coords = coords, kwargs...)
end

function Makie.plot!(sp::SunpathPlot)
    t, _, el, az = _normalize_input(sp[1][], sp.theme.t_col[])
    vals = dayofyear.(t)

    # only handle cartesian coordinates in the recipe
    scatter!(
        sp,
        az,
        el;
        color = vals,
        colormap = sp.colormap[],
        markersize = sp.markersize[],
    )

    return sp
end

end # module
Which I then use like this:
"""Plot solar positions using SolarPosition.jl."""

using Dates
using DataFrames
using GLMakie
using SolarPosition

# define observer location (latitude, longitude, altitude in meters)
obs = Observer(28.6, 77.2, 0.0)

# a whole year of hourly timestamps
times = DateTime(2023):Hour(1):DateTime(2024)

# compute solar positions
positions = solar_position(obs, times)

# plot positions from NamedTuple
sunpathplot(positions, coords = :polar)
The resulting plot looks okay:
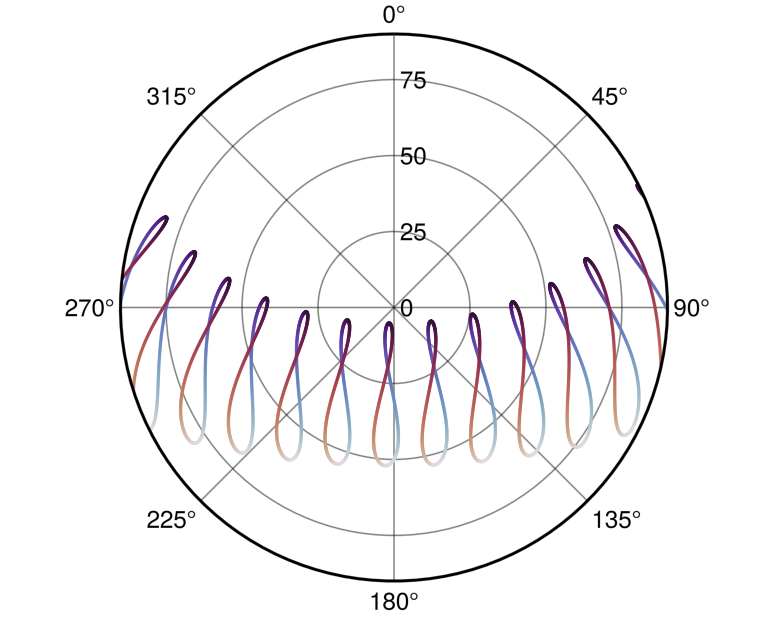
But I don’t think this is very ideal.
According to the docs, I think I should be using convert_arguments.
I also need to be able to select the right axis type (PolarAxis or regular Axis) and configure it properly in each case. There isn’t really much the user would be able to configure in this type of plot. It would be nice if I could just dispatch :polar or :cartesian for the plot type and on NamedTuple and Tables for the type of data input.
