Upon reading the tutorial in algebraofgraphics package it sounded really promising.
I wanted to plot a heatmap of an image that was recorded with a camera which I wasn’t
able to do.
Is this just not supported or do I need to transform the data in some way?
Here is my minimal example:
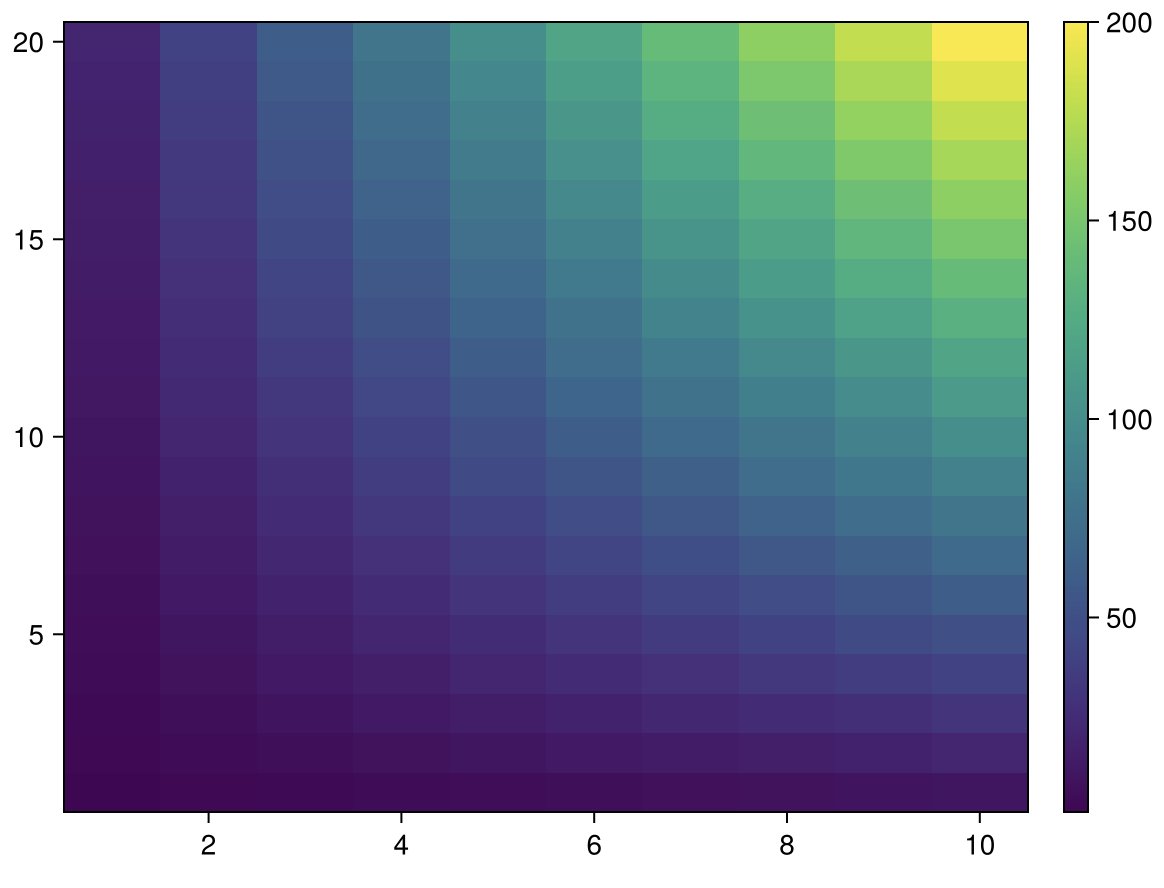
using AlgebraOfGraphics
ex = reshape([i * j for i in 1:10 for j in 1:20], (10, 20))
ex_draw = mapping(ex) * visual(heatmap)
draw(ex_draw, scales(Color=(; colormap=:viridis)))
which results in the following error:
ERROR: No aesthetic mapping defined yet for plot type Heatmap with scientific eltypes (AlgebraOfGraphics.Continuous(),). AlgebraOfGraphics can only use plot types if it is told which attributes and input arguments map to which aesthetics like color, markersize or linewidth for example.
Stacktrace:
  [1] aesthetic_mapping(T::Type{Heatmap}, scitypes::AlgebraOfGraphics.Continuous)
    @ AlgebraOfGraphics ~/.julia/packages/AlgebraOfGraphics/KKbhj/src/aesthetics.jl:51
  [2] aesthetic_mapping(plottype::Type, attributes::Dictionaries.Dictionary{Symbol, Any}, scitypes::Vector{AlgebraOfGraphics.ScientificType})
    @ AlgebraOfGraphics ~/.julia/packages/AlgebraOfGraphics/KKbhj/src/aesthetics.jl:32
  [3] aesthetic_mapping
    @ ~/.julia/packages/AlgebraOfGraphics/KKbhj/src/aesthetics.jl:29 [inlined]
  [4] compute_scale_properties(processedlayers::Vector{ProcessedLayer}, scales::AlgebraOfGraphics.Scales)
    @ AlgebraOfGraphics ~/.julia/packages/AlgebraOfGraphics/KKbhj/src/algebra/layers.jl:198
  [5] compute_axes_grid(d::Layer, scales::AlgebraOfGraphics.Scales; axis::Dictionaries.Dictionary{Symbol, Any})
    @ AlgebraOfGraphics ~/.julia/packages/AlgebraOfGraphics/KKbhj/src/algebra/layers.jl:302
  [6] compute_axes_grid
    @ ~/.julia/packages/AlgebraOfGraphics/KKbhj/src/algebra/layers.jl:298 [inlined]
  [7] _draw(d::Layer, scales::AlgebraOfGraphics.Scales; axis::Dictionaries.Dictionary{…}, figure::Dictionaries.Dictionary{…}, facet::Dictionaries.Dictionary{…}, legend::Dictionaries.Dictionary{…}, colorbar::Dictionaries.Dictionary{…})
    @ AlgebraOfGraphics ~/.julia/packages/AlgebraOfGraphics/KKbhj/src/draw.jl:169
  [8] _draw
    @ ~/.julia/packages/AlgebraOfGraphics/KKbhj/src/draw.jl:166 [inlined]
  [9] draw(d::Layer, scales::AlgebraOfGraphics.Scales; axis::@NamedTuple{}, figure::@NamedTuple{}, facet::@NamedTuple{}, legend::@NamedTuple{}, colorbar::@NamedTuple{}, palette::Nothing)
    @ AlgebraOfGraphics ~/.julia/packages/AlgebraOfGraphics/KKbhj/src/draw.jl:97
 [10] draw(d::Layer, scales::AlgebraOfGraphics.Scales)
    @ AlgebraOfGraphics ~/.julia/packages/AlgebraOfGraphics/KKbhj/src/draw.jl:87
 [11] top-level scope
    @ REPL[83]:1
Some type information was truncated. Use `show(err)` to see complete types.
So I guess I just don’t understand the aesthetic thing yet properly. I also figured I am using
“0.10.7” as I assume that the other packages demand I use that version so I can not use
show_aesthetics.