Hi,
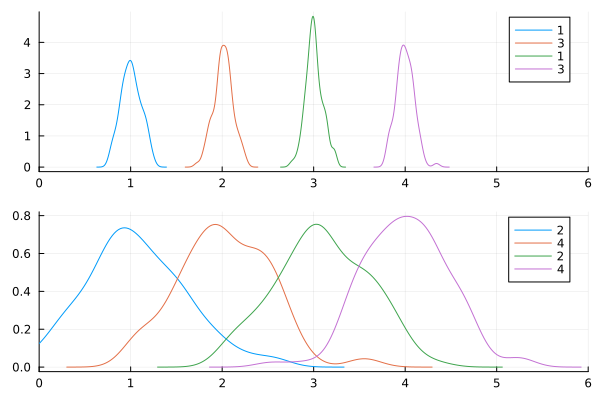
I would like to add the same label to two subplots. In the example below, the densities and colors are correct, but the label should be 1 2 3 4 for each subplot. Is there a way to correct this issue?
Thanks!
using Distributions
using StatsPlots

x = [[rand(Normal(i,.1),100) rand(Normal(i,.5),100)] for i ∈ 1:4]

density(x, layout=(2,1), label=[1 2 3 4], xlims=(0,6))