Using the new Makie 0.24 recipe system, I want to create the StatsPlots.jl recipe for errorline (see original definition).
Here is a simplified version of the plume errorline.
This might be very simple but could not figure out how to do it properly from the docs.
What I want
- Pass all regular
Lineattributes to the main line (color, alpha, linewidth, etc). I tried withMakie.shared_attributesbut it does not work as expected (see usage example below). - For secondary lines (the plume lines), I want to have separate attributes (color, alpha, linewidth) with some default values (some equal to the main line, like
color). Ideally, same as Lines attributes with secondary in front. - A parameter
secondarylinesto set the secondary lines to plot that can be a integer or vector.
Currently, I have the following code that works partially:
- The default colors for main line is always black instead of default Makie colors.
- Changing main line attributes like
colororalphathrows an error since they are not expected attributes ofSimpleErrorLine. - I use
plt.x[]andplt.y[]to get the converted arguments, is there a better way? Will it work with interactive backends?
using CairoMakie
using StatsBase: mean

Makie.@recipe SimpleErrorLine (x, y) begin
    # arguments of Lines
    "Color for secondary elements (plume lines)"
    secondarycolor = :gray60 # how to have default matching main line color?
    "Alpha value of range"
    secondaryalpha = 0.1
    "Width of secondary lines"
    secondarylinewidth = 1
    # original argument
    "Number of plume lines to plot"
    secondarylines = 100 # could also be a vector
end

function Makie.plot!(plt::SimpleErrorLine)
    # Get converted arguments
    x = plt.x[]
    y = plt.y[]

    # Attributes for secondary lines
    secondarycolor = plt.secondarycolor
    secondaryalpha = plt.secondaryalpha
    secondarylinewidth = plt.secondarylinewidth
    secondarylines = plt.secondarylines[]

    # Attributes for main line
    valid_attributes = Makie.shared_attributes(plt, Lines)

    # Check y dimensions
    ndims(y) !== 2 && error("ndims(y) !== 2")
    size(y, 1) !== length(x) && error("size(y, 1) !== length(x)")

    # Compute center and distribution for each value of x
    y_central = mean(y; dims=2)
    y_central = dropdims(y_central; dims=2)

    if secondarylines isa Integer
        sub_idx = 1:secondarylines
    elseif secondarylines isa AbstractVector
        sub_idx = secondarylines
    else
        error("secondarylines must be Integer or AbstractVector, got $(typeof(secondarylines))")
    end

    for j in sub_idx
        lines!(plt, x, y[:, j], color=secondarycolor, alpha=secondaryalpha, linewidth=secondarylinewidth)
    end

    # Base line
    lines!(plt, valid_attributes, x, y_central)

    return nothing
end
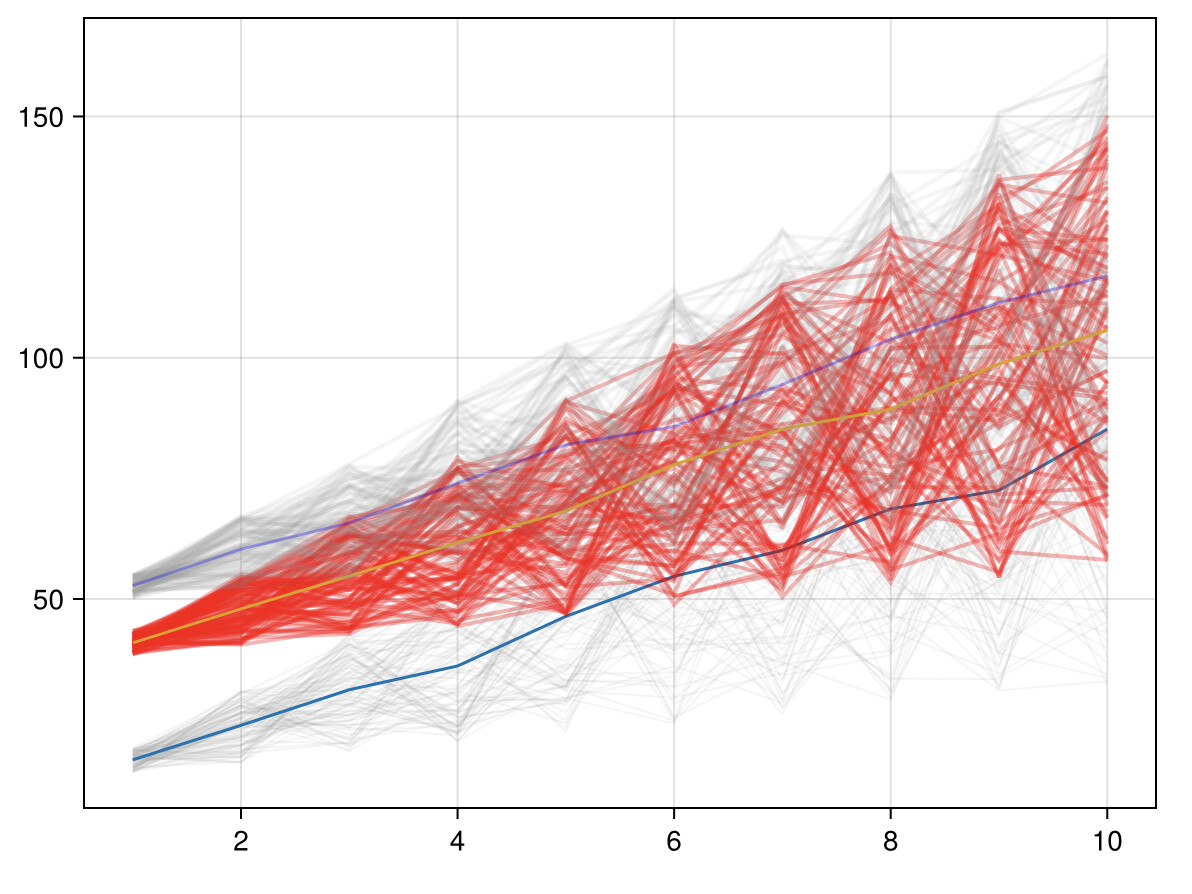
Usage example:
xerror = 1:10
yerror = fill(NaN, 10, 100, 3)
for i = axes(yerror, 3)
    yerror[:, :, i] = collect(1:2:20) .+ rand(10, 100) .* 5 .* collect(1:2:20) .+ rand() * 100
end

fig = Figure()
ax = Axis(fig[1, 1])
simpleerrorline!(ax, 1:10, yerror[:, :, 1])
simpleerrorline!(ax, 1:10, yerror[:, :, 2], secondarycolor=:red, secondaryalpha=0.3, secondarylinewidth=2)
simpleerrorline!(ax, 1:10, yerror[:, :, 3], color=:blue, alpha=0.3, secondarylinewidth=2) # ERROR: Invalid attributes color and alpha
fig