I thoguht I remembered/have-understood well the layout scheme of Makie, especially after visiting again the complex layout tutorial (Creating complex layouts | Makie) . But I guess not, because I cannot really understand why the following figure is the way it is:
Here is the code that generates the figure (minutes my caligraphically-hand-written annotation):
fig = Figure(size = (600, 600))
ax = Axis(fig[1,:][1,1])
fracax = Axis(fig[1,:][1,2]; width = 50, limits = (0,1,0,1), ylabel = "fractions",
    yaxisposition = :right,
)
hidedecorations!(fracax; label = false)

# example plot
scatter!(ax, rand(10), rand(10))

# then..
extra_axs = [Axis(fig[2,:][i, :]; ylabel = "lalala") for i in 1:2]
for ax2 in extra_axs
    lines!(ax2, -0.001.*rand(10)) # important to have large y ticks
end

rowsize!(fig.layout, 2, Relative(0.4))

display(fig)
as my anotation says, I simply cannot understand why the scatter axis at the top does not extend more to the left, but rather its extend is limited by the lines axes below it.
I checked, and fig.layout is correctly composed out of 2 separate layouts, as is done in the “Complex layouts” Makie tutorial.
So what am I missing? how are the two supposedly independent layouts communnicating here?
The two layouts share a column edge with the protrusion gap behind that, so that gap is sized such that both layouts’ protrusions can fit (the axis decorations sticking out). If you want to break that protrusion mechanism up you need to use a different alignmode like Mixed or Outside on one of them or both of them. As you’re currently creating the layouts implicitly you’d either change that to explicit or grab them via content(....)
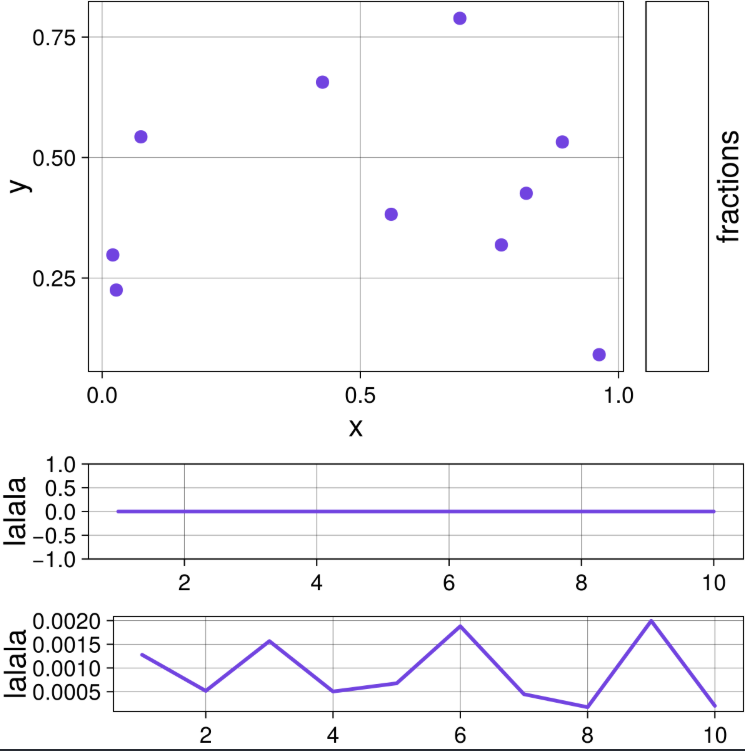
I’ve been able to make the scatter axis go all the way to the left as intentional, but now the two lines axes are missaligned. I guess there isn’t an “alignmode” for hte whole GridLayout? Here’s the code that produces the figure above, where I’ve intentionally added different signs to show the different padding:
fig = Figure(size = (600, 600))
ax = Axis(fig[1,:][1,1]; xlabel = "x", ylabel = "y")
fracax = Axis(fig[1,:][1,2]; width = 50, limits = (0,1,0,1), ylabel = "fractions",
    yaxisposition = :right,
)
hidedecorations!(fracax; label = false)

ax.alignmode = Mixed(left = 0)
fracax.alignmode = Mixed(right = 0)
# example plot
scatter!(ax, rand(10), rand(10))

# then..
extra_axs = [Axis(fig[2,:][i, :]; ylabel = "lalala") for i in 1:2]
for (i, ax2) in enumerate(extra_axs)
    lines!(ax2, (2i - 2)*0.001.*rand(10)) # important to have large y ticks
    ax2.alignmode = Mixed(left = 0)
end

rowsize!(fig.layout, 2, Relative(0.4))

display(fig)