Interactive plot data inspection with Makie (à la PlotlyJS)

What’s the latest on being able to inspect data interactively in Makie? I mean something similar to what PlotlyJS has by default, where you can for example point the cursor at a point in a scatter plot and it will give you a tooltip showing the coordinates of that point:

image

(from 3d scatter plots in JavaScript)

6 Likes

My understanding is that the missing puzzle piece is 3D (and 2D for API consistency) object picking. Because then you could tie observables to show/hide the billboard with the related data of your choice. I don’t know how much of an implementation effort this is.

+1 on missing this feture a lot

It’s not that this particularly hard to do, it’s just that nobody took the time to do it yet. As quick proof of concept:

using GLMakie
fig, ax, p = scatter(rand(Point3f0, 100))
t = text!(ax, " ", position = first(p[1][]), visible = false, halign = :left)

on(events(fig.scene).mouseposition) do mp
    plt, idx = mouse_selection(fig.scene)
    if plt == p && idx != nothing
        t.position = p[1][][idx]
        t[1] = string(p[1][][idx])
        t.visible = true
    else
        t.visible = false
    end
end
fig
4 Likes

It gets harder for things that don’t have a one to one correspondence of picking index to plot data. Try it with a barplot, for example. The other harder thing might be to get it to work without having to point exactly at specific pixels. It is very annoying to use if you have to perfectly have to point at 0.5 px wide lines

1 Like

It is very annoying to use if you have to perfectly have to point at 0.5 px wide lines

We have a pick(scene, mouseposition, range) which should help with that.

And sure, some plots will require some extra work to behave nicely, but it’s not like we’re missing something fundamental like point picking.

3 Likes

So the range thing is for that purpose? I’ve never seen it in use. And yes, the fundamental thing is there (though it would be nice to have picking in WGLMakie so all the widgets etc work there as well) but in my experience the gap to having something that feels nice to use can still be pretty wide. Just to manage expectations :slight_smile:

Microsoft’s SandDance has a nice version of this. It’s open source and it’s available as a vscode extension. It might have some good inspiration.

3 Likes

@jzr, wow! Thanks for this exceptional tip. SandDance is probably the best thing since sliced bread.

The plot below was done with two mouse clicks: (i) drag CSV file to VSCode data tree, and (ii) right click file to View it in SandDance; and voilà:

4 Likes

Adapting this a little bit, I’m trying to use hlines! and vlines! to draw lines from the point being inspected to the y and x axes. The xmax and ymax arguments are in axis space though, whereas I’d like to specify this in data space. Is that possible? Or should I just be simply drawing ordinary lines from the x- and y-axis? Either way is there a function for transforming between data and axis space? I tried searching the docs but couldn’t come up with it.

If I may revive this interesting topic. Since Makie has evolved over the last years, is there an easy way to activate data picking/inspection in newer versions?
Having this as default behaviour is, to my opinion, a real strength of PlotlyJS. It would be great to have an easy way to activate this in Makie.

Data inspection could hardly be easier:

di = DataInspector()

https://docs.makie.org/stable/documentation/inspector/index.html#inspecting_data

Works on 2D and 3D plots and very customizable.

Picking I’m less familiar with but I think is well supported: Events · Makie

1 Like

That is really useful!
Any idea on how to make it return coordinates instead of indices on a 2D map?

What do you mean exactly by 2D map? In general though if the default doesn’t meet your needs then have a look at the Custom Text and Extending DataInspector sections of that page.

thanks! I will now study how to extend it.

What I initially meant is that if I make a heatmap in which I provide coordinates (heatmap(x,y,z)), I get this with PlotlyJS:


x is coordinate x, y is coordinate y and z is the value of the field z at that location.

Now with GLMakie, I get this style:

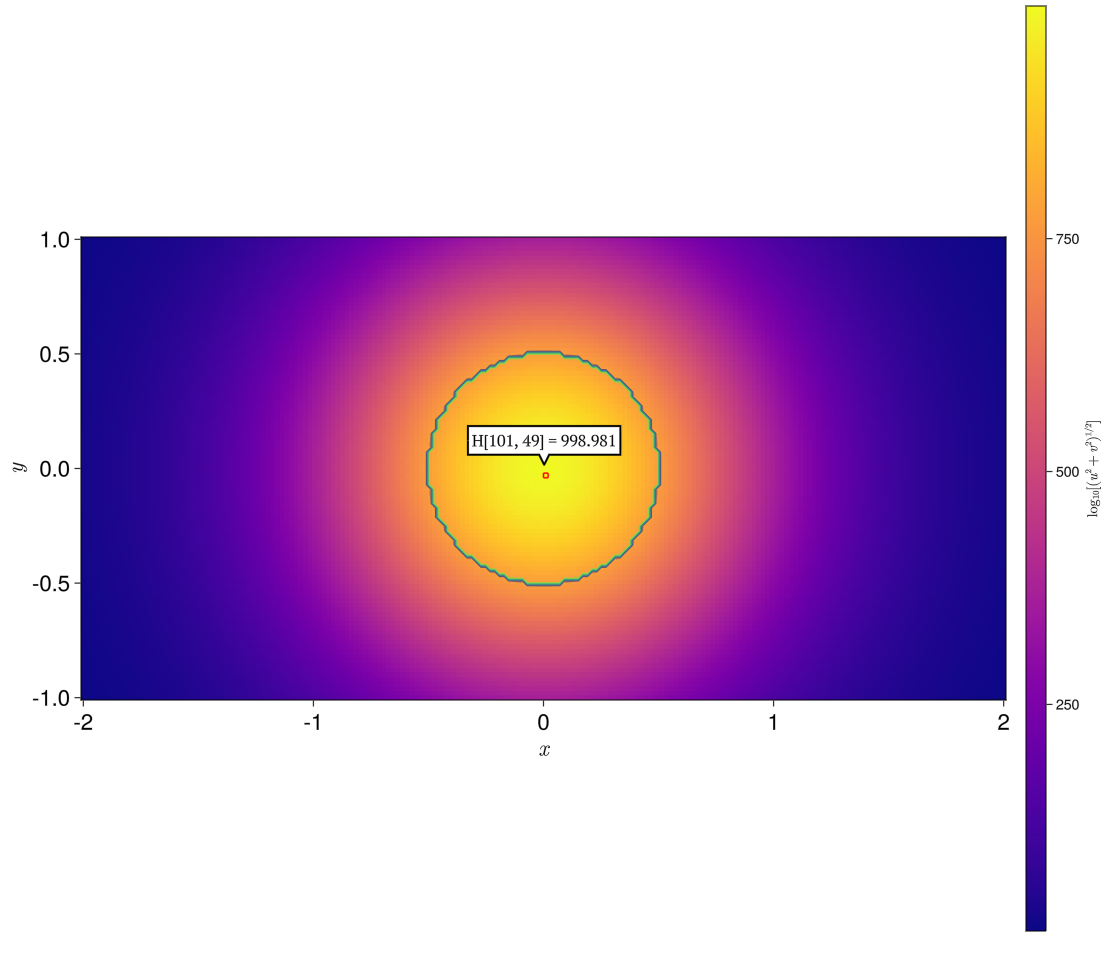
101 and 49 are indices and the value of the field. It is already extremely useful but I would have liked to have the same information (x,y,z) as with PlotlyJS.

If you have the indices you should be able to work out the x, y coordinates, no?

Sure. I’d like them to appear directly in the inspector as in PlotlyJS. So for this I guess I have to learn how to customise the inspector.

1 Like

Could make sense to make this the default. Can you open an issue?

3 Likes